SPY $575 By End of MonthAMEX:SPY , NYSE:ES , GETTEX:MES - It looks like we may be headed back to the neckline of the double top that we broke on March 4th, 2025. That would set a target of around $575-ish before we make the next leg down - matching NASDAQ:DJT and $XHB.
SPY trade ideas

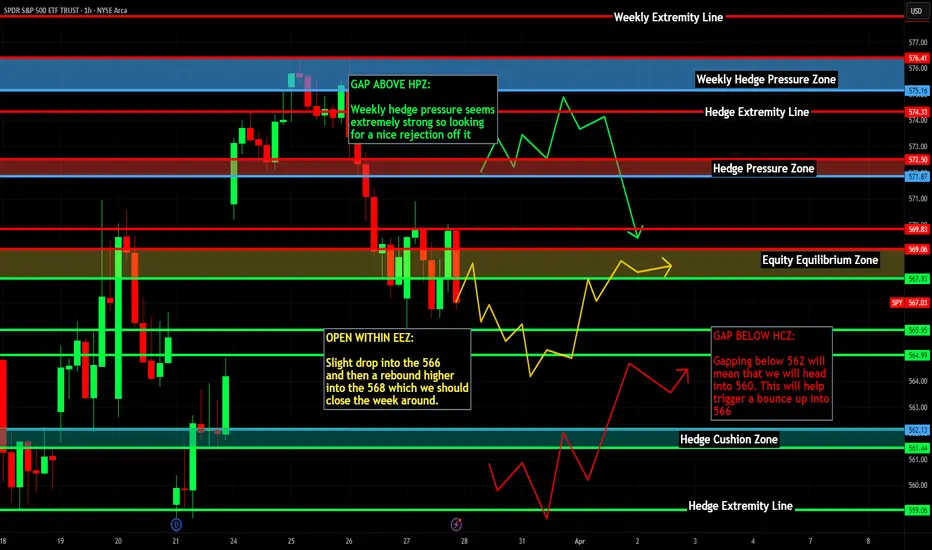
SPY/QQQ Plan Your Trade For 3-28-25 : Carryover in Counter TrendToday's pattern suggests the SPY/QQQ will attempt to move downward in early trading. The SPY may possibly target the 564-565 level before finding support. The QQQ may possibly attempt to target the 475-476 level before finding support.
Overall, the downward trend is still dominant.
I believe the SPY/QQQ may find some support before the end of trading today and attempt to BOUNCE (squeeze) into the close of trading.
Gold and Silver are RIPPING higher. Here we go.
Remember, I've been telling you of the opportunities in Gold/Silver and other market for more than 5+ months (actually more than 3+ years). This is the BIG MOVE starting - the BIG PARABOLIC price rally.
BTCUSD has rolled downward off the FWB:88K level - just like I predicted. Now we start the move down to the $78k level, then break downward into the $58-62k level looking for support.
Love hearing all of your success stories/comments.
GET SOME.
Happy Friday.
#trading #research #investing #tradingalgos #tradingsignals #cycles #fibonacci #elliotwave #modelingsystems #stocks #bitcoin #btcusd #cryptos #spy #gold #nq #investing #trading #spytrading #spymarket #tradingmarket #stockmarket #silver

SPY’s Epic Crash: Bearish Flag Unleashed!Buckle up, trading fam, because the SPDR S&P 500 ETF Trust (SPY) just pulled a move so wild, it’s giving Keeping Up with the Kardashians a run for its money. We’re talking a bearish flag breakdown on the 4-hour chart that’s got more twists than a Game of Thrones finale, more drama than a Bachelor rose ceremony, and more profit potential than a Shark Tank pitch gone viral. If you’re ready to laugh, learn, and maybe make some cash, then grab your popcorn—this 2,500-word rollercoaster is about to take you on a ride you won’t forget! 🎢
Act 1: SPY’s Golden Era—Living Its Best Barbie Life
Let’s set the scene: it’s late October 2024, and SPY is strutting its stuff like it’s Margot Robbie in Barbie. The price climbs from $570 to a dazzling $607.98 by mid-January 2025—a 6.5% glow-up that’s got traders swooning harder than Ken at a Dreamhouse party. SPY’s basically saying, “I’m not just an ETF—I’m iconic,” as it basks in the glow of a bull market hotter than a Love Island villa.
But here’s the tea: even the shiniest stars can fall. By mid-January, the Stochastic Oscillator at the bottom of the chart is flashing “overbought” signals louder than a Real Housewives reunion meltdown. It’s the first sign of trouble—like when you realize the DJ at the club just played “Sweet Caroline” for the third time, and the vibe’s about to go south. SPY’s living large, but the party’s about to get crashed, Jersey Shore style.
Act 2: The Flagpole Plunge—SPY Sinks Faster Than the Titanic
Cue the dramatic music, because mid-January 2025 is when SPY decides to pull a full-on Titanic. The price plummets from $607.98 to $566.77 in a matter of days—a $41.21 drop, or 6.8%, that’s got traders screaming “I’m not okay!” louder than a Euphoria episode. This sharp decline is the flagpole of our bearish flag pattern, and it’s a doozy. SPY’s sinking faster than Jack and Rose’s ship, and the bulls are left clinging to the wreckage like there’s no room on the door. 🚢
The Stochastic Oscillator dives into oversold territory (below 20), confirming the bearish momentum is stronger than the Hulk after a double espresso. It’s a bloodbath on Wall Street, and SPY’s the main character in this tragic plot twist. But just when you think the drama’s over, SPY decides to play coy—like a Bachelor contestant who says “I’m not here for the right reasons” but sticks around for the drama anyway. Enter the consolidation phase, aka the “flag” part of the bearish flag pattern. Let’s break it down, shall we?
Act 3: The Flag—SPY’s Tease Game Is Stronger Than a Love Island Bombshell
From late January to mid-February 2025, SPY enters a consolidation phase that’s more tantalizing than a Love Island bombshell walking into the villa. The price bounces between $566.77 and $577.74, forming a sneaky little upward-sloping channel. It’s like SPY’s playing hard to get, teasing traders with a “Will I rally? Will I crash?” vibe that’s got everyone on edge. The Stochastic Oscillator hovers below 50, like a villa couple who’s “just talking” but definitely not coupled up yet.
This consolidation is the “flag” in the bearish flag pattern, and it’s a classic setup. Think of it as SPY taking a quick breather after its big fall, sipping a cocktail by the pool before diving back into the drama. Bearish flags are continuation patterns, meaning the price is likely to keep falling after this little flirt-fest. It’s like when you’re watching The Masked Singer—you know the reveal’s coming, but the suspense is what keeps you glued to the screen. And trust me, you won’t want to miss the next act.
Act 4: The Breakout—SPY Says “I’m Out!” Like a RuPaul’s Drag Race Exit
Mid-February 2025 arrives, and SPY decides it’s done with the games. The price breaks below the lower trendline of the flag at $566.77, and it’s like watching a RuPaul’s Drag Race queen sashay away after a lip-sync battle: dramatic, fierce, and leaving the bulls in the dust. The breakout confirms the bearish flag pattern, and the bears are strutting their stuff like they just won the crown. 👑
The price doesn’t just dip—it plunges to $546.33 by late March 2025, a further drop of $20.44 (or 3.6%) from the breakout point. The Stochastic Oscillator dives back into oversold territory, confirming the bearish momentum is back with a vengeance. SPY’s basically telling the bulls, “You better work—because I’m not!” as it leaves them gagging on the runway.
Let’s talk about the measured move—the price target for this bearish flag. We take the length of the flagpole ($41.21) and project it downward from the breakout point ($566.77). That gives us a target of $525.56. SPY doesn’t quite hit that mark—it bottoms out at $546.33—but it gets close enough to make traders sweat harder than a Chopped contestant with 30 seconds left on the clock. It’s a solid performance, even if it didn’t stick the landing perfectly.
Pop Culture Parallels: SPY’s Bearish Flag Is a Reality TV Showdown
Let’s take a step back and look at this chart through a pop culture lens, because SPY’s bearish flag is basically a reality TV showdown. The initial uptrend from October to January is the honeymoon phase—think The Bachelor contestants on their first group date, all smiles and champagne. 🥂
The flagpole drop in mid-January is the drama bomb, like when a contestant gets caught kissing someone else in the hot tub. The consolidation phase is the confessional montage, where everyone’s talking smack and plotting their next move. And the breakout? That’s the rose ceremony—SPY’s handing out its final rose to the bears, and the bulls are sent packing with nothing but a suitcase and some tears.
Trading Tips: How to Slay This Bearish Flag Like a Drag Race Superstar
Now that we’ve had our fun, let’s get down to business. How can you trade this bearish flag like a Drag Race superstar? Here’s the tea, served piping hot:
1. Short the Breakout (Sashay, Don’t Shantay)
When SPY broke below the flag at $566.77, that was your cue to short the stock faster than you can say “Sashay away!” A short position here could’ve netted you a $20.44 gain per share as the price dropped to $546.33—enough to buy yourself a new wig for the next challenge.
2. Set a Stop-Loss (Don’t Get Read for Filth)
To avoid getting read for filth by a fake-out, set a stop-loss above the flag’s upper trendline at $577.74. That way, if the breakout flops harder than a Drag Race comedy challenge, you’re safe.
3. Target the Measured Move (Go for the Crown)
The measured move target of $525.56 was the goal, but SPY stopped at $546.33. That’s still a win—like making it to the top 4 but not snatching the crown. If you’d shorted at the breakout, you’d be serving looks and profits.
4. Watch for a Bounce (Don’t Sleep on the Comeback)
As of late March 2025, SPY’s at $546.33, and the Stochastic is oversold. This could mean a short-term bounce is coming, like a Drag Race queen returning for an All-Stars season. Keep an eye on resistance at $566.77 and $577.74—if SPY breaks above those, the bears might be in for a shady twist.
The Bigger Picture: Is SPY’s Downtrend the New Black?
Let’s zoom out for a hot second. Before this bearish flag, SPY was in a strong uptrend for months, living its best life like a Vogue cover star. This pattern marks a potential trend reversal, like when skinny jeans went out of style and baggy pants became the new black. If the downtrend continues, the next support level could be around $540—or even lower if things get really messy.
But here’s the million-dollar question: is this the start of a bigger bear market, or just a temporary dip? It’s like trying to predict the winner of Survivor—nobody knows, but everyone’s got a theory. The Stochastic being oversold suggests a bounce might be near, but the overall trend is still bearish. So, keep your wits about you, because this market’s shadier than a Real Housewives dinner party.
Why This Chart Is More Addictive Than a Love Is Blind Binge
If you’re still here, you’re officially obsessed—and I don’t blame you! This SPY chart is more addictive than a Love Is Blind binge because it’s got all the elements of a great reality show: drama, suspense, and a cast of characters (the bulls and bears) who can’t stop fighting. The bearish flag is the villain we love to hate, and the price action is the love triangle we can’t stop watching.
Plus, trading is a lot like reality TV. You’ve got your highs (the uptrend), your lows (the flagpole drop), and those messy in-between moments (the consolidation). But when the breakout happens, it’s like the finale episode where someone finally gets engaged—or in this case, the bears get their moment in the spotlight. 💍
Final Thoughts: Don’t Miss the Next Episode of SPY’s Reality Show
SPY’s bearish flag breakdown is a masterclass in technical analysis, wrapped in a package of drama and sass that’d make even the most stoic trader crack a smile. Whether you’re a Wall Street pro or a newbie just here for the tea, this chart has something for everyone.
So, what’s next for SPY? Will it hit that $525.56 target, or will the bulls stage a comeback like a Love Is Blind couple at the altar? Only time will tell, but one thing’s for sure: you won’t want to miss the next episode of this reality show. Keep your eyes on the chart, your finger on the trigger, and your sense of humor intact—because in the world of trading, you’ve got to laugh to keep from crying. 😜
Join the Trading Villa!
If you loved this recap of SPY’s bearish flag drama, don’t ghost me like a Love Island ex! Drop a comment with your thoughts—are you shorting SPY, or are you waiting for a bounce? And if you want more trading tea, puns, and reality TV references, hit that follow button faster than you can say “I’m here to make friends.” Let’s spill the tea and make some money together! 🍵

Nightly $SPY / $SPX Scenarios for March 28, 2025🔮 🔮
🌍 Market-Moving News 🌍:
🇺🇸📊 Core PCE Inflation Data Release: The Personal Consumption Expenditures (PCE) Price Index for February is set to be released. Economists anticipate a 0.3% month-over-month increase and a 2.5% year-over-year growth, aligning with previous figures. As the Federal Reserve's preferred inflation gauge, this data could influence monetary policy decisions.
🇺🇸🛍️ Consumer Spending and Income Reports: February's personal income and spending reports are due, with forecasts indicating a 0.4% rise in personal income and a 0.5% increase in personal spending. These figures will provide insights into consumer behavior and economic momentum.
🇺🇸🏠 Pending Home Sales Data: The Pending Home Sales Index for February is scheduled for release, with expectations of a 2.0% increase, following a 1.0% rise in January. This index offers a forward-looking perspective on housing market activity.
📊 Key Data Releases 📊
📅 Friday, March 28:
💵 Personal Income (8:30 AM ET):
Forecast: +0.4%
Previous: +0.9%
Measures the change in income received from all sources by consumers.
🛍️ Personal Spending (8:30 AM ET):
Forecast: +0.5%
Previous: -0.2%
Tracks the change in the value of spending by consumers.
📈 PCE Price Index (8:30 AM ET):
Forecast: +0.3% month-over-month; +2.5% year-over-year
Previous: +0.3% month-over-month; +2.5% year-over-year
Reflects changes in the price of goods and services purchased by consumers.
🏠 Pending Home Sales Index (10:00 AM ET):
Forecast: +2.0%
Previous: +1.0%
Indicates the number of homes under contract to be sold but still awaiting the closing transaction.
⚠️ Disclaimer: This information is for educational and informational purposes only and should not be construed as financial advice. Always consult a licensed financial advisor before making investment decisions.
📌 #trading #stockmarket #economy #news #trendtao #charting #technicalanalysis
Pure TA On The Market And My PlaysThis video will explain TA where
we maybe going and how to follow the stoch
catch bottoms tops and stay in position long time
using stoch vol ma


U.S. Propaganda Contrarian TradeU.S. Propaganda vs. Market Reality: A Contrarian Trade Strategy: This idea leverages the growing disconnect between U.S. rhetoric and the increasingly cautious stance of its trading partners and traveling public.

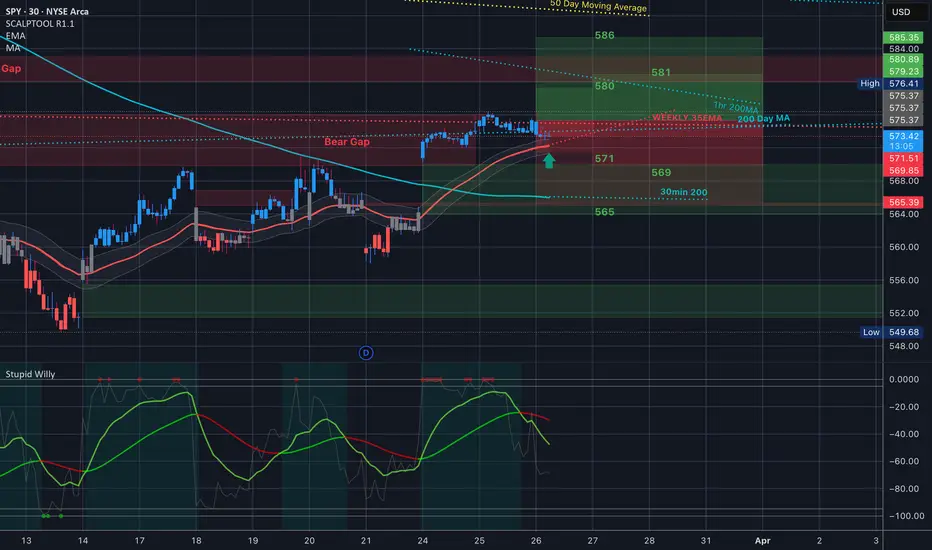
$SPY rejected at the intraday 35EMA, 30min 200 pointing lowerAMEX:SPY That downward facing 30min 200MA. Moving averages are a measure of momentum and we're not going too far up with these downward facing MA's... mentioned this in last nights video. We bounced on the 30min 200 but failed to turn it upward...

$SPY March 27, 2025AMEX:SPY March 27, 2025
15 Minutes.
AMEX:SPY struggling to move upwards as expected.
For the rise 561.48 to 576.42 it has retraced 61.8 levels to 567 levels.
Not it is taking support at 200 averages in 15 minutes
For the fall 576.33 to 567.92 570-571 is a good level to short for an initial target 565- 566 levels for the day.
Since below 200 in 5 minutes not a time to g long for the yet.

SPY/QQQ Plan Your Trade For 3-27-25 : Breakaway PatternToday's Breakaway pattern suggests the markets will continue to melt downward (possibly attempting to fill the Gap from March 24).
I strongly believe the SPY/QQQ are completing the "rolling top" pattern I suggested would happen near or after the March 21-24 TOP pattern my deeper cycle research suggested was likely.
At this point, things are just starting to line up for a broader market decline while the current EPP pattern plays out as a Breakdown of the EPP Flagging formation (moving into consolidation).
Gold and Silver are RIPPING higher. Yes, I do expect a little bit of volatility near these recent highs. But, I also expect metals to continue to rally higher from these levels over the next 10-15+ days. Watch the video.
Bitcoin is stalling/topping - just as I suggested it would months ago.
Now we see how the market move into this new trending phase and how far this current trend will drive price trends. I believe the SPY/QQQ/Bitcoin will all continue to move downward while Gold/Silver move (RIP) higher on this breakaway move.
This is a PERFECT trader's market.
Get some.
#trading #research #investing #tradingalgos #tradingsignals #cycles #fibonacci #elliotwave #modelingsystems #stocks #bitcoin #btcusd #cryptos #spy #gold #nq #investing #trading #spytrading #spymarket #tradingmarket #stockmarket #silver

SPY Hanging on Mid-Range Support – Will It Rebound or Flush?⚠️ Technical Analysis (TA) – Intraday View
Current Price: ~$567.56
* SPY recently experienced a CHoCH followed by BOS, but now formed a new CHoCH → bearish shift in structure.
* Price is testing a minor demand zone between 566–567, holding just above the larger support base at 560–555.
* Volume increased on recent sell candles, showing seller control — but Stoch RSI signals nearing exhaustion.
Indicators:
* MACD: Bearish crossover – but histogram showing potential slowing of momentum.
* Stoch RSI: Deeply oversold and starting to turn up – signals possible bounce/retracement coming.
🔐 Key Levels
Support Zones:
* 566–567 → Short-term demand / micro CHoCH
* 560 → Highest negative GEX zone – PUT support
* 555–550 → Strong liquidity zone & 2nd PUT Wall
Resistance Zones:
* 572.5 → HVL zone and broken structure
* 580 → Gamma wall zone, strong CALL resistance
* 590–600 → Extended resistance levels for swings
🧠 GEX & Options Flow Analysis (TanukiTrade Pro)
* GEX Sentiment: 🔴🔵🔴 — Bearish skew, with a weak neutral pocket
* IVR: 26.4 → Volatility low, but near option seller zone
* IVx avg: 20.7
* PUT$%: 53.8% — Strong bearish hedging flow
* CALL Resistance: 580 → gamma ceiling
* PUT Wall:
* 560 → Highest negative NetGEX (dealer support)
* 555 & 550 → backup defense zones
* HVL: 572.5 → key flip level
📌 Current setup shows dealers are heavily short gamma below 572.5, causing negative delta pressure.
🛠️ Trade Setups
📈 Bullish Setup – Bounce from 566–567
* If SPY holds and reclaims 570 with strong bid, a move toward HVL possible
* Entry: Break and hold above 570
* Target 1: 572.5
* Target 2: 578
* Stop-Loss: Below 565
* Options Play:
* Buy Apr 3 $575 Calls
* OR Call Debit Spread: Buy $570 / Sell $580
📉 Bearish Setup – Breakdown Below 565
* Confirmed lower high and break of demand → opens trapdoor
* Entry: Below 565 with momentum
* Target 1: 560
* Target 2: 555
* Target 3: 550
* Stop-Loss: Above 570
* Options Play:
* Buy Apr 3 $560 Puts
* OR Put Spread: Buy $565 / Sell $555
🧭 Final Outlook
* Bias: Bearish → unless 572.5 HVL is reclaimed.
* SPY is caught between strong PUT support at 560 and heavy gamma ceiling at 580.
* If market sentiment worsens or macro triggers hit, 555 is the magnet zone.
* If buyers step in and hold 566+, bounce setups are likely — but it must reclaim HVL for any strength.
📛 Disclaimer: This analysis is for educational purposes only and does not constitute financial advice. Please manage your risk accordingly.
Massive Rising wedge 4hr chartMassive rising wedge on 4hr chart!! Been tracking this the last couple weeks. It’s been respecting the trend lines for the this pattern. I believe this is either last leg down in the pattern or one more leg up before it completes the pattern and drops. Target would be 550-560 next week and then 540-550 the following week.
With April 2nd with tariffs being finalized we could see this move happen between now and then. If this is the last leg down before it completes the pattern and drops more and breaks the bottom trend line it will happen by either Friday or Monday. If it does leg up it will most definitely be April 2nd when it breaks through bottom trend line. Let’s see how this plays out but for those saying that we are not in a bear market and the bottom was back 552 then your not paying attention. I feel like the bottom could one of 3 targets - $490-20% drop, $430-20% drop, $307-50% drop. Now this all depends on Senior Cheeto. I am thinking 20%or 30% is ideal.

Nightly $SPY / $SPX Scenarios for March 27, 2025 🔮 🔮
🌍 Market-Moving News 🌍:
🇺🇸🚗 Auto Tariffs Announced: President Trump has announced a 25% tariff on all cars not made in the U.S., effective April 2. This move is expected to impact the automotive industry and could influence market sentiment.
🇬🇧📉 UK Inflation Falls: UK inflation has decreased to 2.8% in February, down from 3% in January, raising speculation about a potential interest rate cut by the Bank of England in May. This development may have implications for global markets.
📊 Key Data Releases 📊
📅 Thursday, March 27:
📉 Initial Jobless Claims (8:30 AM ET):
Forecast: 226,000
Previous: 223,000
Indicates the number of individuals filing for unemployment benefits for the first time during the past week, offering insight into the labor market.
📈 Gross Domestic Product (GDP) – Second Revision (8:30 AM ET):
Forecast: 2.3% annualized growth
Previous: 2.3%
Provides a second estimate of the nation's economic growth for the fourth quarter of 2024.
🏠 Pending Home Sales Index (10:00 AM ET):
Forecast: 1.0%
Previous: -4.6%
Measures housing contract activity for existing single-family homes, offering insights into future home sales.
⚠️ Disclaimer: This information is for educational and informational purposes only and should not be construed as financial advice. Always consult a licensed financial advisor before making investment decisions.
📌 #trading #stockmarket #economy #news #trendtao #charting #technicalanalysis
Toast me or Roast me - I'm still learning & practicing charting
I was looking at descending scallops and some of their features via thepatternsite.com
What is valid or invalid about this charting here??
I have the high peak marked from the ATH that topped the uptrend on AMEX:SPY and the most recent upward breakout prior to trending back down on the 1HR as of yesterday. I know I will only be able to confirm in hindsight but is there good reason here for me to say we have the makings of a long-er term descending scallop in play here?
Thanks to all. I enjoy reading your opinions and discussions on the daily.

Spy What's up guys?
Here's a update .. I'll cover NYA,Qqq,IWM,XLk,XLF
Here's NYA
Notice the price action above the yellow line? That's Wyckoff distribution.
Yesterday we retest that prior support.. the next leg down on this should start.
For more information just research Wyckoff distribution!
XLF (Banks)
Exact same chart as NYA.. Wyckoff retest... Pain incoming
XLK
This is the most important chart you will see on this post!
XLK is the biggest sector on the SPY! If XLK goes down so will the spy!
Daily chart is a major rising wedge..
4hour chart showing a bear flag
That same bear flag is showing on SPY and
Qqq
IWM
Bear flag inside of bear channel
To sum it up if Qqq breaks below 477 tomorrow or Friday , DO NOT CATCH THE KNIFE!!!!! We will most likely make new lows for March..
Core PCE tomorrow but don't forget about end of quarter rebalancing on Friday.. the last hour of the market WILL see some wild moves ..
Next week is a black out period with no earnings and it is the week of Tariffs. I think if they do flush they will try to get most of the selling done before earnings season kicks off April 7th.
Sorry if this is a little rushed but I've been busy.. I'll try to update this more tomorrow..
Lastly
Vix
I thought they would flush this back to 14.73 but when QQQ rejected off it's 200ma , Vix bounced off it's 200ma (No coincidence).. unless PCE sends this below 17.00 tomorrow we are headed back to 23.00
If you need a bigger picture just look at my previous spy post
But let me break this down to you simple.
This spy, you see the yellow area I am highlighting? THAT IS WYCKOFF DISTRIBUTION!
NOW GO TO YOUR WEEKLY CHART , ZOOM OUT AND LOOK AT THE STRUCTURE OF
TVC:DJI
NASDAQ:MSFT
NASDAQ:QQQ
NASDAQ:NVDA
NASDAQ:AAPL
They are all showing distribution , some 6months worth of it.. So what happens when distribution support is broken as It was on SPY at 580?
What happens next is a Reset! It is exactly what happened in 2022...

SPY 03/26Looks like it's about to roll down. First target would be monthly VWAP. Not financial advice. Could also range a little bit longer.
$SPY Analysis & Targets for Day Trading My bet is that we keep trading Sidewards today with the 35EMA as support intradaty
570/572 @0.30 is a nice spread to start here.
Tariffs and Trade: Order Behind the Chaos?
AMEX:SPY , NASDAQ:TLT . Tariffs: It seems that mainstream media is depicting this administration's economic policies as chaotic, suggesting a sense of uncertainty and confusion about what’s happening. However, we can infer that the situation is far from messy. Eventually, tariffs worldwide could be balanced on fairer terms, leading to much more efficient global trade. In cases where tariffs remain reciprocally high, it might simply indicate a shift to a different taxation mechanism, moving away from direct government taxation.

The End of MarchMy feeling is the bearish cycles into the end of March is playing out now and this upward correction is finished. We may revisit the bottom of both QQQ and SPY in the short term. If wrong, the SPX will get above 5780 today

SPY WILL FALL|SHORT|
✅SPY has hit a key structure level of 577.50$
Which implies a high likelihood of a move down
As some market participants will be taking profit from their long positions
While others will find this price level to be good for selling
So as usual we will have a chance to ride the wave of a bearish correction
SHORT🔥
✅Like and subscribe to never miss a new idea!✅
Disclosure: I am part of Trade Nation's Influencer program and receive a monthly fee for using their TradingView charts in my analysis.

SPY/QQQ Plan Your Trade for 3-26-25 : Flat-Down PatternToday's Flat-Down pattern for the SPY/QQQ suggests the markets will consolidate in a sideways channel, generally drifting downward.
As I've been warning all of you for the past month+, the market will likely roll over into a topping formation over the next few days, then start an aggressive downward trend targeting $525-535 on the SPY.
Today's video covers some details related to my expectations and how traders can prepare for the bigger moves I see pending.
Gold and Silver are poised for a potentially BIG BREAKOUT move to the upside. And I still believe Gold/Silver are going to rally another 15-20% within the next 30-45 days.
Bitcoin should follow the SPY/QQQ into a "rollover top" type of pattern then shift into a downward price trend over the next few days.
Everything is following my predictions/expectations almost perfectly.
Now, we try to profit from some of these big moves.
Go get some.
#trading #research #investing #tradingalgos #tradingsignals #cycles #fibonacci #elliotwave #modelingsystems #stocks #bitcoin #btcusd #cryptos #spy #gold #nq #investing #trading #spytrading #spymarket #tradingmarket #stockmarket #silver

$SPY March 26, 2025AMEX:SPY March 26, 2025
15 Minutes.
Sideways consolidation on for moving averages to catch up.
For the moment upside is capped 576-579 levels which is also top of channel.
576 - 578 is a good sell for 571-573 levels target for today.
Since 3 moving averages are nearby 9, 21 and 50.
I expect a one-sided movement.
So far, no trade for me for the week.

$SPY Bounce to 590s?Hey everyone, it's your boy pic. AMEX:SPY looks primed for a typical ABC correction to around 590 going into the second half of March. Chart lines up with NextPivot Indicator and FIB levels just as pretty as you please. Nice look with clear stops. Good luck!
