STO: March 5, 2024STO (Santos Limited) || March 5, 2024
Master of Elliott Wave Analysis: Shane Hua (CEWA-M)
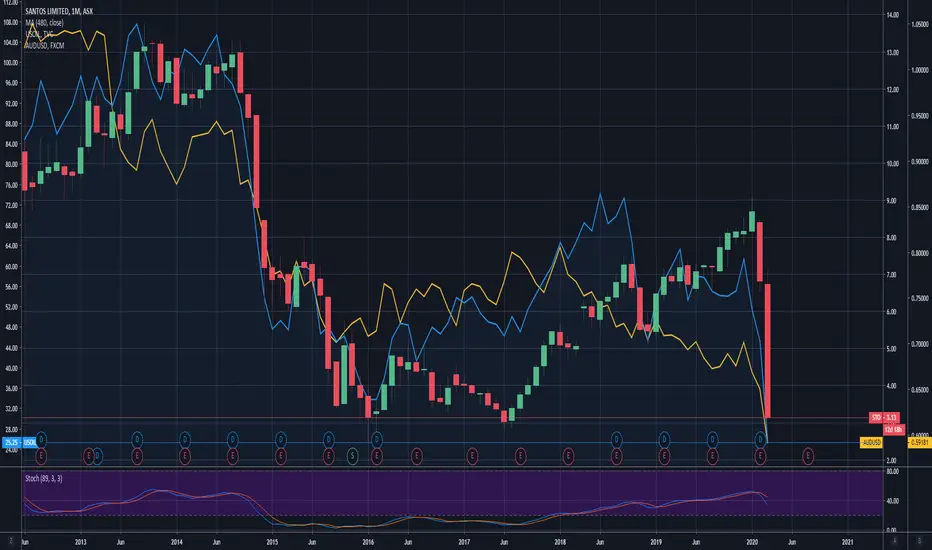
(Left chart) In the broader context, we observe a price increase following a Leading Diagonal pattern, which concluded at 7.98. Subsequently, there's been a three-wave decline labeled ABC(circled, green). At this point, it's uncertain what will occur next, as Leading Diagonals typically follow a decline. The support level is around 0.786, where the price is still holding higher. Therefore, we shouldn't dismiss the possibility of Santos Limited continuing to decline slightly, as indicated by the alternate wave count in purple. In summary, wave b (circled, green) hasn't yet concluded, so wave c (circled, green) will likely revert to the alternate wave count. However, I anticipate a Bull market with wave 3 (circled, green) moving higher, as long as the low at 6.57 remains intact.
(Right chart) Now, turning to the short-term outlook (4-hour chart), it reinforces the discussion. There are a few scenarios to consider here: as long as the low of 6.99 holds, the bullish outlook remains valid. Conversely, if the low of 6.99 is breached, we'll see the alternate wave count described in the broader context come into play.
STO trade ideas

Long Santos #STO #ASX # ASX200 # Trading #breakoutHi all,
An ascending triangle is classified as a continuation chart pattern.
Continuation patterns are expected to lead to the continuation of an existing trend.
While the ascending triangle is considered a bullish continuation pattern, exceptions are quite possible. It’s not infrequent to see it develop in downtrend conditions.
Breakouts can also happen in both directions. Statistically, upward breakouts are more likely to occur, but downward ones seem to be more reliable.
Price is in an interesting area here.
Strong resistance around 8.4
Depending on your strategy offers a great RR.
Regards,

STOthis is the 2W chart for the previous post.
i need to tyype more so i will
previous post was good.
but i dont want to type itup again

but Santos2week STO chart looking good.
RSI shows a breakout
and price confirms it.
expect the $9 mark to be broken
oil price has moved first but now
the oil producers will follow .
confirmation that oil prices will remain
high for a long time...,.. unless the house of saud
starts pumping more.


STO - Vol Profile TradeASX:STO
LT EMA trend bullish, ST EMA trend starting to turn bullish. Bulish volumes starting to dominate.
Two potential nodes identified. The POC at 6.34 which is the POC of the last 4 years.
The other is around the 6.90 node, the POC of the last year where the stock has been ranged bound.
I'm placing my trade entry around the long term POC, wait for the pullback to the 6.40 level for the entry.
Let me know what you think?

STO - ASX - SantosOil may be topping out.
Momentum is turning on Crude futures, taking profits here while the economy is slowing.
Oil has ripped since March 2020.
Taking the contrarian view..
Everyone seems to be calling for $100 oil, as much as I think it will get there in due time it is due for a pullback.
Will money flow into monetary metals?

Divergence STO (any other Energy & Natural Gas ASX Listed)STO LONG thesis is pretty simple.
Energy companies generally have a high correlation to their underlying commodity. In recent times a gap has opened up (illustrated by yellow line)
Oil & Natural Gas have moved higher substantionally YOY%
STO share price has come off, potential risk could be this seismic shift to green energy and flow of funds to those projects and companies.
My opinion is that this gap will close as oil and gas continue to rally in $$$.
Disclaimer - this is not investment advice, just an observation and should be taken as such. Do your own research.
Thanks.

Key Reversal Buy SetupTechnical confirmations:
* Key reversal (KR) buy signal
* MACD bullish
* Trend line respected
* Strong support
* 38.2% Fibonacci retracement
Target: 7.78
Stop: 6.44

STO - Retesting Resistance/ Support Line for next leg upI'm predicting that Santos is retesting support here and once it bounces off will signal upwards move.

Santos share prices break the downtrend channel at 5.08Share prices made the vital break out of the downward price channel in yesterday's trades in the H1 time frame after falling from 5.86 in August 2020. The critical price level to watch is at around 5.18 and 5.35, a break above 5.35 could see share prices head towards the 5.80 targets.
The current critical support and resistance estimates on the price chart are based on my indicator, predicting future price movements based on price action.
Critical support level estimates - 5.18, 5.08, 4.90, 4.73, and 4.56
Critical resistance level estimates - 5.35, 5.45, 5.63,5.80, and 5.97


SANTOS 20% INCOMINGSANTOS (ASX:STO) After a great market Announcement on 28.05 (completing ConocoPhillips Acquisition) we have bounced off support of this ascending wedge and its crunch time. 20% to close the major GAP left by th COVID Crash.
-Respecting Trend of Ascending Wedge (Haven't broken Bearish)
-About to Break Ichimoku Cloud
-RSI not Severely Overbought
-Conversion Line has crossed Base Line back on 21st APR and is still holding spread
-Lagging Line showing us respecting trend but we are approaching a double top
-Testing 100 EMA strongly
Due to the price Mid Major GAP, Still respecting Trend and testing the 100 EMA strongly. I am confident we will see a break through Ichimoku Cloud and close of gap @ 6.51 which is also a Major Resistance area & lines up with -0.27 FIB Extension
Stop loss is below PREVIOUS Structure and Below 0.236 Fib Retracement Level. Risk/Reward sitting at the minimum 2:1
Testing Week for SANTOS.
These Ideas are NOT 'Financial Advice'!. Scenarios are based off a mixture of TA and Fundamentals current at the time. All IMO GLTAH. Happy Hunting!!!

SANTOS TRADE FORMED A NICE CHANNEL,CLIMBING TOWARDS MEASURED MOVE FROM THE DROP, MEASURED MOVE INSIDE CHANNEL IS PLAYING OUT ON SECOND TOUCH OF RESISTANCE LINE. Getting into good Fib Zone, showing strength , more touches on resistance than support indicating up swing. Fundamentally strong also, Couple of big projects in the NT waiting for Rona to piss off.


STO long term holdIF STO can break out of the long term down channel, we will average up. add to our existing positions in STO.
day chart shows an established uptrend intact.
Buy if price reaches $10 and hold till price
retests all time highs

STO, Santos Limited - Breakout on Cup & HandleTechnical analysis is applied in all regulated financial markets, and the higher the capitalization, the more we get the statistics of Winrate % and Risk Reward that we know and that is why we filter certain companies based on their economics.
Our strategies use classic technical analysis, spreads on some commodity futures, the purchase of shares with options hedging, the sale of options and some special strategies in Forex.
Everything always starts from the allocation of capital according to a certain model of money management.
Only with the strict discipline of all this you can be profitable in the long run.
Do not believe in fairy tales if you plan to make steady profits over 40% per year, it's just luck that it will end soon and very badly.

$STO $5.96 beware the news. You're missing a shoulder bruvSure itll gap up this am,nice exit for ST traders, but cant see it staying up
Chart has notes

Short IDEA - STOOil looks to have peaked, STO good short, GAP near 5.50, could be inverse H&S or continues lower if Oil makes new lows, top in the short term is in...

STO closes the week with a strong finish.STO made a new high for the week and closed strongly. Price breakout is confirmed. We will buy a small position in STO.

