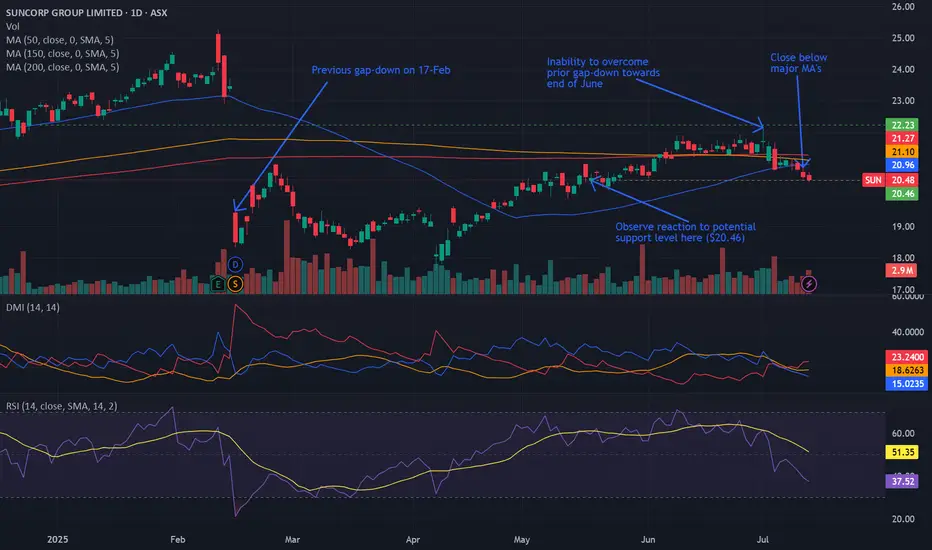
Bearish potential detected for SUNEntry conditions:
(i) lower share price for ASX:SUN along with swing of DMI indicator towards bearishness and RSI downwards, and
(ii) observing market reaction around the share price of $20.46 (open of 19th May).
Stop loss for the trade would be:
(i) above the potential prior resistance of $21.36 from the open of 5th June, or
(i) above the high of the recent swing high once the trade is activated (currently $22.14 from the high of 1st July), depending on risk tolerance.
SUN trade ideas
Buying small qty of SUN stop at 17.49SUN is doing well, looking to break though it's all time high. given the overall market action and this price action taking a small exposure to share with tight stop.

SUNSuncorp Group Limited is an Australian finance, insurance, and banking corporation based in Brisbane, Queensland, Australia.
Testing multi-month overhead supply. Volume + strong candle structure would be welcomed. Global insurers + re-insurers have been leaders (see some of the U.S & German operators).

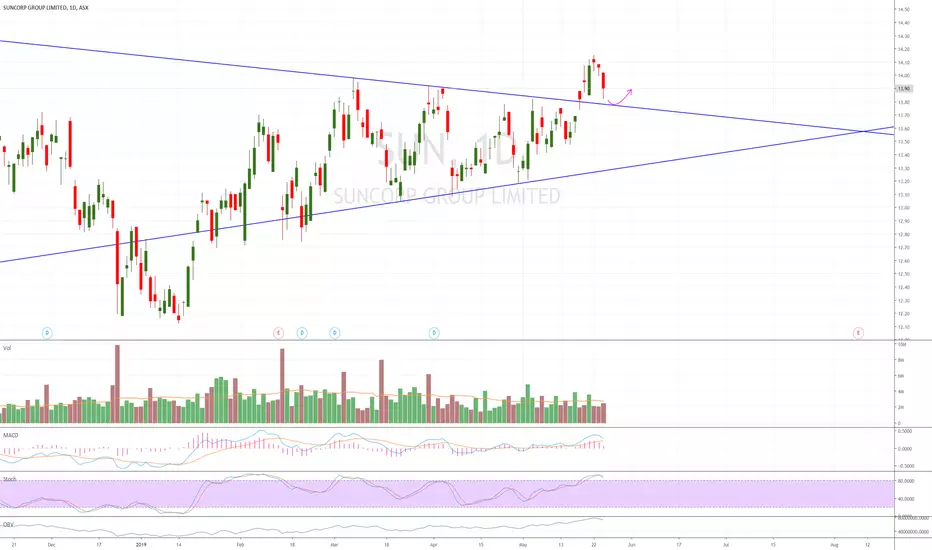
SUN - 6 months SYMMETRICAL TRIANGLE══════════════════════════════
Since 2014, my markets approach is to spot
trading opportunities based solely on the
development of
CLASSICAL CHART PATTERNS
🤝Let’s learn and grow together 🤝
══════════════════════════════
Hello Traders ✌
After a careful consideration I came to the conclusion that:
- it is crucial to be quick in alerting you with all the opportunities I spot and often I don't post a good pattern because I don't have the opportunity to write down a proper didactical comment;
- since my parameters to identify a Classical Pattern and its scenario are very well defined, many of my comments were and would be redundant;
- the information that I think is important is very simple and can easily be understood just by looking at charts;
For these reasons and hoping to give you a better help, I decided to write comments only when something very specific or interesting shows up, otherwise all the information is shown on the chart.
Thank you all for your support
🔎🔎🔎 ALWAYS REMEMBER
"A pattern IS NOT a Pattern until the breakout is completed. Before that moment it is just a bunch of colorful candlesticks on a chart of your watchlist"
═════════════════════════════
⚠ DISCLAIMER ⚠
The content is The Art Of Charting's personal opinion and it is posted purely for educational purpose and therefore it must not be taken as a direct or indirect investing recommendations or advices. Any action taken upon these information is at your own risk.


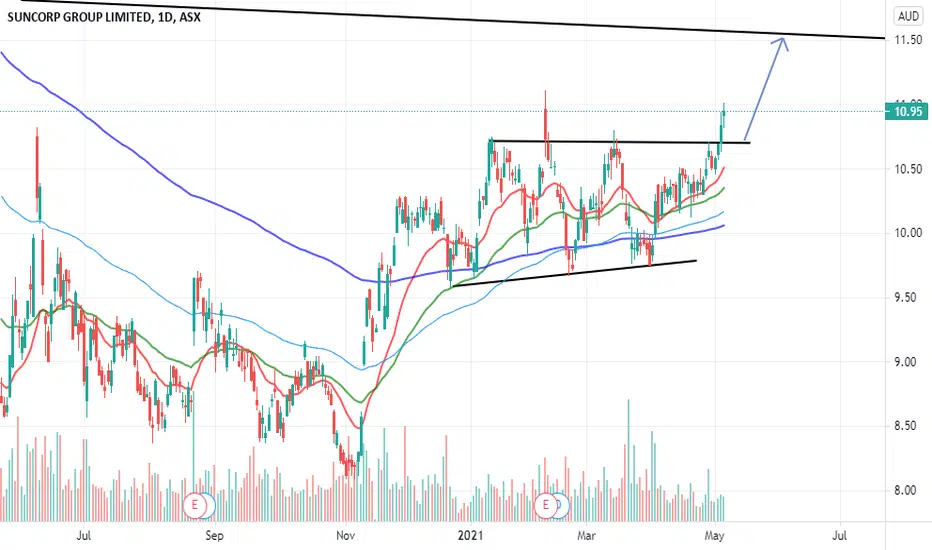
SUN - Bullish Trade PlanAfter making a Higher High SUN had retraced lower to Support of $9.60, and have bounced off quite well. Price is above the 200SMA and 50SMA, indicating that its bullish. I think SUN should continue higher with targets as below:
TP1 - 10.70 (potential gain 4%)
TP2 - 10.96 (potential gain 6.5)
Stoploss - $9.50.
Please note these are my own notes, by no means trading advice. Please do your own research before entering into any trade.


Possible short opportunity 2 x bearish divergence on RSI / MFI indicator 1 x on stochastic with likely 2nd , directional candles trending down


suncorp ..... typical trend and correction details on chart...
breakout of descending trend line can be ending correction ...
buy after breakout
