Bullish potential detected for TLCEntry conditions:
(i) higher share price for ASX:TLC along with swing up of the DMI indicators and swing up of the RSI indicator, and
(ii) observation of market reaction at the support/resistance level at $5.31 (from the open of 12th May).
Stop loss for the trade would be, dependent of risk tolerance (once the trade is activated):
(i) below the support level from the open of 21st November (i.e.: below $5.05), or
(ii) below the recent swing low of 3rd June (i.e.: below $4.96).
TLC trade ideas

(ASX): TLC - THE LOTTERY COPORATION LIMITED || March 12, 2024(XDJ): CONSUMER DISCRETIONARY
(ASX): TLC - THE LOTTERY COPORATION LIMITED || March 12, 2024
Master of Elliott Wave Analysis: Shane Hua (CEWA-M).
(Left chart): The broader context (1D chart) reveals that from the low at 4.35, the bull market began to unfold. Wave 4-red appears to have concluded at the low of 4.99 with a Triangle Pattern, followed by wave 5-red continuing to rise higher to achieve the next price target at 5.31.
(Right chart): The short-term outlook provides more detail on wave 5-red's ascent. As long as the price remains above the low of 4.99, the .618 level may potentially play a supportive role in further developing the bull market to higher levels.

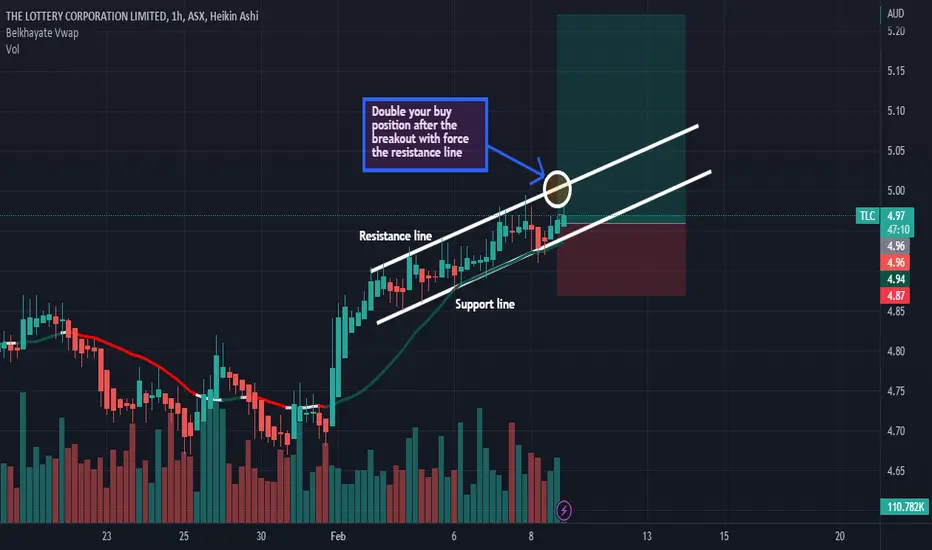
Buy ideaAs you see on the chart we have a buy idea after the spring effect on the vwap and support line. Thanks!