TLS double bottom, swing longTLS actually has a valid trade, but the problem is, it's on a weekly, so the hold time is in years
TLS trade ideas

Telstra - Major Aussie communications providerTelstra with a potential inverse head and shoulders pattern. Formed higher lows on the longer time frame. Entry point potential around $3.88.
Keeping an eye on this.

ASX $TLS -Telstra Restructuring and Question mark on Growth Telstra Corporation Ltd
ASX: TLS ASX:TLS
- Telstra 5G wave could do a trick...
- Telstra planning to push for 5G instead of fixed broadband telecom line.
- Restructuring for TLS has been painful but surely step in the right direction.
- Dividend policy has been reviewed that shows that TLS management may be aiming for growth and giving competitors run for their bucks.

ASX:TLS perfect contraction ??ASX:TLS gave over 33% in just over one year from last analysis - what a peaceful ride
just hovering around for several weeks on line that was acting as major resistance
looks like stock is taking time for next rigger
growth is an issue
Having captured captail gains plus life long dividend scenario can't get better than this..

TLS LONGBREAKOUT
Major up
Current down
Broke on the upside with volume spike. Took position $4.38.
gap filled far from breakout candle close.
RRR 1:2
Entry $4.38
TP $4.51
SL $4.30
LIKE
1) Breakout happen near EMA. might provide good RRR.
2) Reduce position sizing after that from 100% to 60% after observing that theres no follow through.
DISLIKE
1) On hindsight, it does look like a marginal breakout candle formation. (not long enough)
2) Chase trade due to fear of missing out. broke at 4.36 and yet brought at 4.38 (Fear of loss missing out)
3) not confident in the followup move candle came back down to test EMA. The followup momentum dint happen


Earnings watch 3/16 pre-marketEarnings watch 3/16 pre-market:
TLS
RMBL
JBL
DOYU
SVCL
ARCO
LE
MCG
BRCC
BLRX
Do your own due diligence, your risk is 100% your responsibility. This is for educational and entertainment purposes only. You win some or you learn some. Consider being charitable with some of your profit to help humankind. Good luck and happy trading friends...
*3x lucky 7s of trading*
7pt Trading compass:
Price action, entry/exit
Volume average/direction
Trend, patterns, momentum
Newsworthy current events
Revenue
Earnings
Balance sheet
7 Common mistakes:
+5% portfolio trades, capital risk management
Beware of analyst's motives
Emotions & Opinions
FOMO : bad timing, the market is ruthless, be shrewd
Lack of planning & discipline
Forgetting restraint
Obdurate repetitive errors, no adaptation
7 Important tools:
Trading View app!, Brokerage UI
Accurate indicators & settings
Wide screen monitor/s
Trading log (pencil & graph paper)
Big, organized desk
Reading books, playing chess
Sorted watch-list
Checkout my indicators:
Fibonacci VIP - volume
Fibonacci MA7 - price
pi RSI - trend momentum
TTC - trend channel
AlertiT - notification
tickerTracker - MFI Oscillator
www.tradingview.com

TLS telstra longfollowing strong upward trend 14 months now, $4 good entry, $4.50 exit 12%, if consolidates and holds that line next exit $5 for another 10%, 4-5 week time frame for first trade

TLS.ASX_Retracement Trade_LongENTRY: 4.06
SL: 3.89
TP: 4.29
- ADX<20. Would like to be higher.
- RSI>50,RSI<70
- Daily RS +ve
- Daily FFI +ve
- Daily MACD -ve
- Weekly RS +ve
- Weekly FFI +ve
- Weekly MACD -ve
- Retracement to resistance turned support level since breakout of range on 18 Nov 2021.
- Volume dry up on 22 Nov 2021.
- Weekly chart shows possible hidden buying last week.
- Need to account for possible to retrace further to 38.1% fib. level.
- If break previous high 4.09, should expect further price movement up.

TLS breakoutLong term buy and hold on TLS as it has
broken out of a long term range.
PE is 26 which is cheap by todays standards.

TLS @ 18 NOV 2021Text me if you have any questions/comments for me.
-----
TLS
- Previous analysis was done on 23 Sep (red arrow) - Suggested waiting for a successful breakout of $4 resistance before plotting entry
- Since then, the stock retraced back to re-test the 3.70 support levels and slowly rebounded
- Today, it successfully broke out with above average volume
- Next overhead resistance looks to be around 4.50 levels
- R is borderline 10%
- Strategy-to-buy (DYOR) – Suggest plotting entry if believe the stock can have a sustained breakout

TLS WeaknessTelstra showing weakness here, waiting on a price break below support. will come back after some time to add bars to see how this goes.

TLS To be rejectedTLS test a resistance as the OBV sits in the trench.
This is a sign of a Potential failed breakout.
TLS @ 23 SEP 2021 Text me if you have any questions/comments for me.
-----
TLS
- Previous analysis was done on 14 Sep - Suggested half entry at 3.95 levels if believe the stock can successfully breakout of resistance at 4.00 levels
- Since then, the stock had a failed breakout and quickly retraced back to the mid-term support
- Stock is rebounding and is again testing the strong resistance at 4.00 levels again
- Successful breakout looks to be close to 4.10 levels
- R is less than 10%
- Strategy-to-buy (DYOR) – Suggest waiting for successful breakout before plotting entry

Is $5.30 on the horizon for this beast ?With the must hold price support as marked on the chart, can Telstra test the zone of $5.30 over the months ahead ?
Me thinks so, if we see the anticipated major upside breakout.
Keep an eye on Moving average cross-overs for an entry as well as exit. The moving average x overs is worth studying on this chart.
Watch for the fundamental upgrades forthcoming !
This analysis is NOT a FINANCIAL ADVISE.

Momentum to break $4.00(Not Financial Advice)
On the charts it showing the momentum is ready to bust through $4.00 , it's sitting just under at $3.99.
The current price is sitting at $3.95 but the space for the potential run up is there.
Once it breaks through and retest then the steps it has been imitating should kick into gear.
Good to see Telstra is fighting against resistance.

TLS @ 14 SEP 2021TLS
- Previous analysis was done on 6 Sep - Suggested waiting for successful breakout of overhead resistances before entry
- Today’s price action sees the stock convincingly break the 3.90 resistance
- Next strong overhead resistance at 4.00 levels
- Half entry at current levels could provide an avenue to manage overall risk-reward
- R is less than 10%
- Strategy-to-buy (DYOR) – Suggest half entry at current levels if believe the stock can successfully breakout of resistance at 4.00 levels
-----
Text me if you have any questions for me.

TLS @ 1 SEP 2021TLS
- First time doing a written analysis on TLS
- Stock was in a long downtrend since 2015 and this introduces a lot of overhead resistances
- Stock looks to be challenging the 4.00 resistance soon
- R is less than 10%
- Strategy-to-buy (DYOR) – Suggest waiting for successful breakout of overhead resistances before entry and only if comfortable with the multiple overhead resistances

Major Upside Breakout Imminent with this beast.Almost completed accumulation pattern with an imminent major upside breakout pending may best describe the current pattern/price action behaviour. Completion of the pattern will change the major trend to a long awaited bull run. Monthly close below the 12 period simple moving average will trigger a close long signal if and when on hand.
For now, sit tight and enjoy the dividends.....

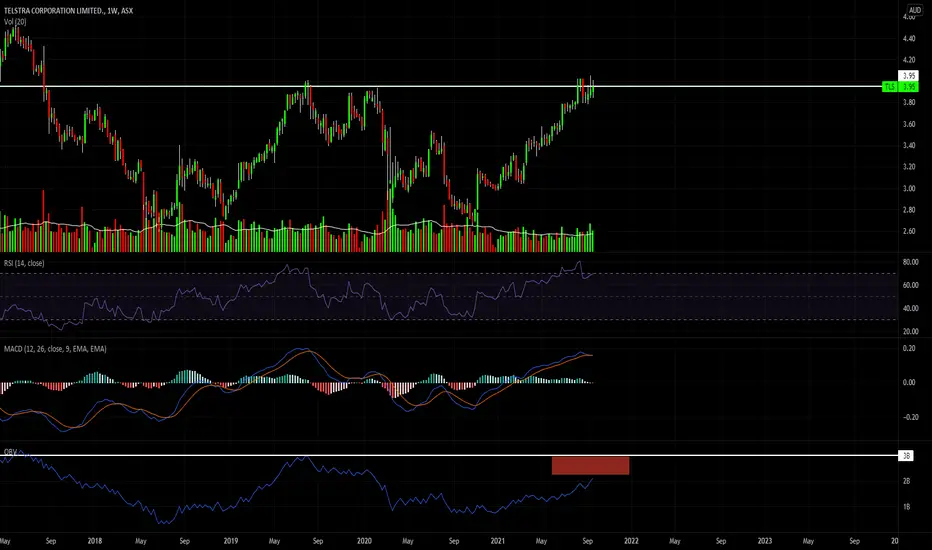
Telstra Jumps On Declared Special DivAbove we see the TLS weekly time frame. Technically, the moving averages are in a bullish stack with the shorter-term green > intermediate orange> longer-term red. Moreover, there is good angle and separation which indicates a strong momentum for the telecom. On a classical charting basis, TLS may have charted a double bottom, which is an accumulation pattern. The company released its results today, saying that it expects to return to full-year growth in its fiscal 22. During the current period, the company paid down debt and monetised more than $2bn of assets. Of note, shareholders will receive a fully-franked dividend (i.e., paid from earnings after tax) of 8cps, which included a special dividend of 3cps.

Is Major Breakout with Telstra on the horizon ?Long term monthly chart of the mighty Telstra with an analysis view of several years. One may call this medium/long term investing.
While back (few years ago) I have published the Telstra chart in anticipation of a medium/long term accumulation which has been in effect since selling climax low which was followed by sharp and decisive climax rally thereafter. Price action had been congested ever since, where the smart money had been carefully conducting their accumulation. In congestion/trading range(marked as Box of Tricks) that we are still in my opinion based is that we are in the last phase as of this writing. If I am correct, price action is now expected to retest CLMAX RALLY HIGH resistance at $4.00.It is also expected to stage a major breakout here by penetrating that resistance level and reversing the major trend to BULL once again. We will see of course ?
Once a major breakout is confirmed, reversing the major trend to bull. I will then calculate a price target for the potential up move and publish it here at tradingview.
For now, I am LONG TELSTRA, which I have been for a while with an investment view of several years at least.
For a financial advice, please see an accredited financial advisor. I am not one and I don't offer that service. All I offer/share is the message which I read from the chart.

TLS - Telstra What an absolute rally we have seen in the monthly session. looking to close strong. with the next monthly trading into some areas of strong resistance. looking to close long if we see a weak close next month.
