US Election patternIs there a US Election month pattern? US Federal elections are always on the first Tuesday following the first Monday in November. This year election day is tomorrow, Tuesday 11/8. Statistically speaking November is a bullish month for US equities. As you can see here on the VTI 1month chart for the past dozen years, 10 out of 11 times November has closed with a green candlestick. Will this November 2022 become 11 out of 12 green monthly candlesticks? If so, that would mean VTI would have to close above $196 by the end of this month. Only time will tell for certain, but probability wise, November has a high probability for having a bullish end result.
Do your own due diligence, your risk is 100% your responsibility. This is for educational and entertainment purposes only. You win some or you learn some. Consider being charitable with some of your profit to help humankind. Good luck and happy trading friends...
*3x lucky 7s of trading*
7pt Trading compass:
Price action, entry/exit
Volume average/direction
Trend, patterns, momentum
Newsworthy current events
Revenue
Earnings
Balance sheet
7 Common mistakes:
+5% portfolio trades, capital risk management
Beware of analyst's motives
Emotions & Opinions
FOMO : bad timing, the market is ruthless, be shrewd
Lack of planning & discipline
Forgetting restraint
Obdurate repetitive errors, no adaptation
7 Important tools:
Trading View app!, Brokerage UI
Accurate indicators & settings
Wide screen monitor/s
Trading log (pencil & graph paper)
Big, organized desk
Reading books, playing chess
Sorted watch-list
Checkout my indicators:
Fibonacci VIP - volume
Fibonacci MA7 - price
pi RSI - trend momentum
TTC - trend channel
AlertiT - notification
tickerTracker - MFI Oscillator
www.tradingview.com
VTS trade ideas

VTI - Broad Index Fund (Sp500)Vti is the entire SP500 index fund with low cost. If you have no clue about companies and stuff and still want to be part of USA who is biggest economy in the world at the moment, VTI is your go to. Markets are struggling so i wanted to look HTF charts and best possible prices to accumilate over time.
Fibonacci is great tool for long term price targets. 0.5 is great start, 0.618-66 golden ratio zone are perfect.
You'll thank me 5-10years later.

Bear market or FOMC market?Bear market or FOMC market?
The standard definition of a bear market is when major U.S. stock indices, such as the S&P 500, drop by 20% or more from their peak. The signs of a weak or slowing economy are typically low employment, low disposable income, weak productivity, and a drop in business profits. In addition, any intervention by the government in the economy can also trigger a bear market. A secular bear market can last anywhere from 2 to 10 years and is characterized by below-average returns on a sustained basis. There may be rallies within secular bear markets where stocks or indexes rally for a period, but the gains are not sustained, and prices revert to lower levels. A cyclical bear market, on the other hand, can last anywhere from a few weeks to several months. Short selling, put options, and inverse ETFs are some of the ways in which investors can make money during a bear market as prices fall.
FOMC Prees Release October 21, 2021. Federal Reserve Board announces a broad set of new rules that will prohibit the purchase of individual securities, restrict active trading, and increase the timeliness of reporting and public disclosure by Federal Reserve policymakers and senior staff. Fed officials traded in individual stocks, real estate securities and stock funds in 2020, a year in which the central bank rolled out a range of pandemic response programs that placed official's day-to-day decisions at the core of what happened in financial markets. Three high-ranking policymakers resigned earlier than they had planned after news of the trading became public.
The policymaking Federal Open Market Committee announced that most of the restrictions will formally take effect on May 1, 2022. The rules will cover FOMC members, regional bank presidents and other officials including staff officers, bond desk managers and Fed employees who regularly attend board meetings. They also extend to spouses and minor children. It prevents senior officials from purchasing individual stocks or funds tracing business sectors and they ban investments in individual bonds, cryptocurrencies, commodities or foreign currencies, among other securities.
Do your own due diligence, your risk is 100% your responsibility. This is for educational and entertainment purposes only. You win some or you learn some. Consider being charitable with some of your profit to help humankind. Good luck and happy trading friends...
*3x lucky 7s of trading*
7pt Trading compass:
Price action, entry/exit
Volume average/direction
Trend, patterns, momentum
Newsworthy current events
Revenue
Earnings
Balance sheet
7 Common mistakes:
+5% portfolio trades, capital risk management
Beware of analyst's motives
Emotions & Opinions
FOMO : bad timing, the market is ruthless, be shrewd
Lack of planning & discipline
Forgetting restraint
Obdurate repetitive errors, no adaptation
7 Important tools:
Trading View app!, Brokerage UI
Accurate indicators & settings
Wide screen monitor/s
Trading log (pencil & graph paper)
Big, organized desk
Reading books, playing chess
Sorted watch-list
Checkout my indicators:
Fibonacci VIP - volume
Fibonacci MA7 - price
pi RSI - trend momentum
TTC - trend channel
AlertiT - notification
tickerTracker - MFI Oscillator
www.tradingview.com

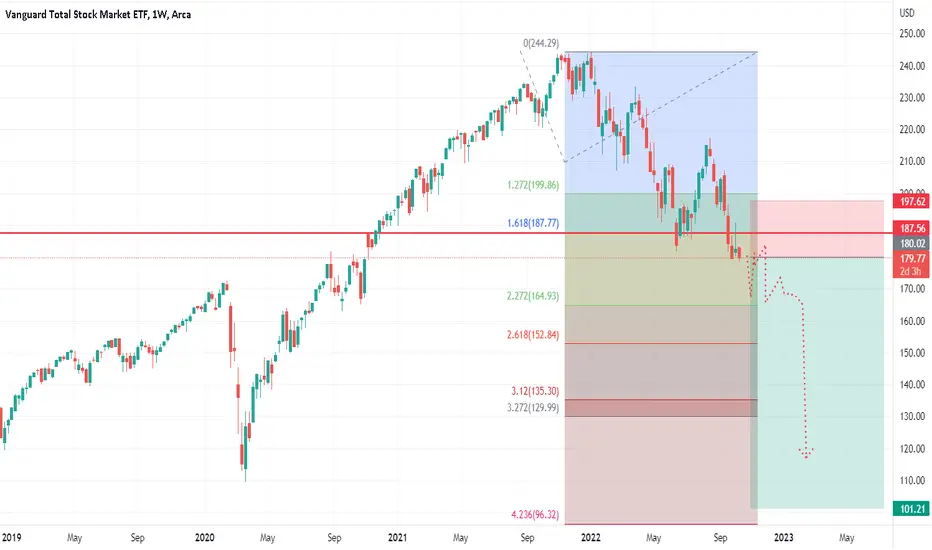
VTI is under its 161 of the topping swing. After complying with the 161 topping tendency, VTI has now made a break of the 161 of the topping swing and held a retest. These are things often seen in macro reversals.
Total Stock Market (Bottom Prediction and Hypothesis)It honestly just makes sense. This should end around 35%. The market will be at its fair value once again.

VTI 4-6 month/ Personal trading planThis post is personal. We all have strategies on trading and the most important things for any trader in my opinion is to finally discover his/her strategy which suites there emotional temperament (pessimist / optimist). intellectual capacity ( children with a few simple rules trade better then many seasoned smart adult analysts/ proven back-testing results) , and their life style (how much time do you have, and the time frame you feel comfortable with).
We trade up to 25 stocks/commodities and about 10 at any given time and are on a mostly weekly cycle. VTI is one of them. 90% of the stock we trade have similar wave patterns (as this cuts down on analyzing time), we short for a hedge. The commodities we trade are more on the monthly cycle trade commodities less often. We analyze with indicators, Elliott and trendlines, we try to ignore the news media. When it comes to Elliott counting we believe the count which make you money is the "right count". Our simple rule is BUY low and SELL high, when his is done consistently you will inevitably see your portfolio go up,.... it works.
Anyway if you have thoughts please feel free to share, again I am sharing a very personalized trading plan this may not fit you temperament, style of trading or your time frame.

VTI 8/19 expiryThis Friday 8/19 is August monthly options expiry. Technically, the risk:reward and probability are to lean short now at this entry point. I'm thinking the market goes sideways at best this week. Here's a Mega Triangular Trend Channel MTTC2.0 (beta) set to 200SMA with 19 levels. And my tickerTracker MFI Oscillator set to 20 with SPY, VTI, QQQ, IWM & DIA.
Do your own due diligence, your risk is 100% your responsibility. This is for educational and entertainment purposes only. You win some or you learn some. Consider being charitable with some of your profit to help humankind. Good luck and happy trading friends...
*3x lucky 7s of trading*
7pt Trading compass:
Price action, entry/exit
Volume average/direction
Trend, patterns, momentum
Newsworthy current events
Revenue
Earnings
Balance sheet
7 Common mistakes:
+5% portfolio trades, capital risk management
Beware of analyst's motives
Emotions & Opinions
FOMO : bad timing, the market is ruthless, be shrewd
Lack of planning & discipline
Forgetting restraint
Obdurate repetitive errors, no adaptation
7 Important tools:
Trading View app!, Brokerage UI
Accurate indicators & settings
Wide screen monitor/s
Trading log (pencil & graph paper)
Big, organized desk
Reading books, playing chess
Sorted watch-list
Checkout my indicators:
Fibonacci VIP - volume
Fibonacci MA7 - price
pi RSI - trend momentum
TTC - trend channel
AlertiT - notification
tickerTracker - MFI Oscillator
www.tradingview.com

Vanguard Total market ETF to fall -26.15% down to 144The Vanguard Total Market ETF on a monthly timescale already highlights an ongoing correction downfall in the ETF marked-to-market net asset value. In the coming months, the Vanguard Total Market ETF could well fall another -26.15%
down to 144 points, where the ETF price trendline would test the IKH Senkou A/B support, which would match up the support line of the structural trading channel.
MACD oscillator also signals an ongoing Sell Signal that will continue its retracement toward the channel.

RSI and 200 week MA suggest a buyMedium to long-term entry is reasonable here, but the 200 week MA is not a precise timing mechanism.
If we are in a secular bear market, moving averages could reverse and no longer be reliable, as seen in 2007 - 09.
Hopefully we are closer to the end than the beginning.

VTI (Total Stock Market)On an analysis earlier that I published, the DXY may be ready for a retracement to the previous wave low. Now reeling back in on the VTI Looks like we may be close to being done with the C phase on this timeframe. Wave C has so far retraced Wave B up to 161%. I don't want to get too greedy until we see economic indicators start to peak out. However, I would like to see if we could reach the 38% retracement of Wave C in the near future. We still ended the week with large sell volume. However, on the 12 hour time frame, some of that sell volume has started to weaken down a bit. We may be early on this assumption. The K and D of the RSI has reached an oversold point. They haven't crossed up past the 20 level just yet. The MacD has crossed the zero line but hasn't shown any indication of momentum shift just yet. I want to be careful with price targets here so I will only keep it at the 38% level for responsible trading. Let's see what happens!
What do you think?

What's up QT?Quantitative Tightening started last Wednesday, June 1st, 2022. FOMC will be undertaking a “phased approach” of quantitative tightening measures beginning with a 3-month period of unwinding $30 billion of Treasuries and $17.5 billion mortgage-backed securities beginning on June 1, 2022. By September, 2022 these caps would increase to $60 billion and $35 billion, respectively. So $47.5 billion per month for the first three months. After this, the total amount to be reduced increases to $95 billion a month, with policymakers prepared to modify their stance should it be necessary to do in the light of economic and financial developments.
June $47.5B
July $47.5B
August $47.5B
September $95B
October $95B
November $95B
December $95B
Total QT 2022 = $522.5B
The nonpartisan Congressional Budget Office estimated that real gross domestic product, or GDP, will grow 3.1% in 2022, driven by consumer spending and demand for services, according to the report released Wednesday 5/25/22. It revised its estimates for GDP growth in 2023 and 2024 upward to 2.2% and 1.5%, respectively, but still below this year’s pace. Here’s what the CBO sees for the U.S. economy at the end of each year:
Real GDP: 3.1% in 2022, 2.2% in 2023, and 1.5% in 2024.
Inflation (measured by CPI): 4.7% in 2022, 2.7% in 2023 and 2.3% in 2024.
Unemployment rate: 3.7% in 2022, 3.6% in 2023 and 3.8% in 2024.
Federal funds rate: 1.9% in 2022, and 2.6% in 2023.
On Friday, 6/3/22 the Record unemployment rate is still holding steady at 3.6% for a 3rd straight month. U.S. employers hired more workers than expected in May 2022 and maintained a fairly strong pace of wage increases. Disposable personal income increased $216.6 billion, or 4.8 percent, in the first quarter 2022, compared with an increase of $20.1 billion, or 0.4 percent, in the fourth quarter. Real disposable personal income decreased 2.0 percent, compared with a decrease of 5.6 percent. Personal saving was $1.21 trillion in the first quarter 2022, compared with $1.39 trillion in the fourth quarter. The personal saving rate—personal saving as a percentage of disposable personal income—was 6.6 percent in the first quarter, compared with 7.7 percent in the fourth quarter.
Do your own due diligence, your risk is 100% your responsibility. This is for educational and entertainment purposes only. You win some or you learn some. Consider being charitable with some of your profit to help humankind. Good luck and happy trading friends...
*3x lucky 7s of trading*
7pt Trading compass:
Price action, entry/exit
Volume average/direction
Trend, patterns, momentum
Newsworthy current events
Revenue
Earnings
Balance sheet
7 Common mistakes:
+5% portfolio trades, capital risk management
Beware of analyst's motives
Emotions & Opinions
FOMO : bad timing, the market is ruthless, be shrewd
Lack of planning & discipline
Forgetting restraint
Obdurate repetitive errors, no adaptation
7 Important tools:
Trading View app!, Brokerage UI
Accurate indicators & settings
Wide screen monitor/s
Trading log (pencil & graph paper)
Big, organized desk
Reading books, playing chess
Sorted watch-list
Checkout my indicators:
Fibonacci VIP - volume
Fibonacci MA7 - price
pi RSI - trend momentum
TTC - trend channel
AlertiT - notification
tickerTracker - MFI Oscillator
www.tradingview.com


US Equity Market 2023 PredictionPlease, for the love of goodness, do not trade based on this analysis. This is only the median trajectory angle of the entire US Equity Market the past 13 years. I put trendlines separated equally apart according to this angle. Also, the year dated text on top represents the total market capitalization at that year's end & the corresponding GDP numbers are below. Plus, I noted the total Quantitative Easing ($8,770,000,000,000) + Stimulus ($4,500,000,000,000) since 3/15/2020 to date.
Do your own due diligence, your risk is 100% your responsibility. This is for educational and entertainment purposes only. You win some or you learn some. Consider being charitable with some of your profit to help humankind. Good luck and happy trading friends...
*3x lucky 7s of trading*
7pt Trading compass:
Price action, entry/exit
Volume average/direction
Trend, patterns, momentum
Newsworthy current events
Revenue
Earnings
Balance sheet
7 Common mistakes:
+5% portfolio trades, capital risk management
Beware of analyst's motives
Emotions & Opinions
FOMO : bad timing, the market is ruthless, be shrewd
Lack of planning & discipline
Forgetting restraint
Obdurate repetitive errors, no adaptation
7 Important tools:
Trading View app!, Brokerage UI
Accurate indicators & settings
Wide screen monitor/s
Trading log (pencil & graph paper)
Big, organized desk
Reading books, playing chess
Sorted watch-list
Checkout my indicators:
Fibonacci VIP - volume
Fibonacci MA7 - price
pi RSI - trend momentum
TTC - trend channel
AlertiT - notification
tickerTracker - MFI Oscillator
www.tradingview.com

Where are we VTI?Where are we VTI? Here's a Mega Triangular Trend Channel MTTC2.0 (beta) set to 200SMA with 19 levels. And my tickerTracker MFI Oscillator set to 20 with SPY, VTI, QQQ, IWM & DIA.
Do your own due diligence, your risk is 100% your responsibility. This is for educational and entertainment purposes only. You win some or you learn some. Consider being charitable with some of your profit to help humankind. Good luck and happy trading friends...
*3x lucky 7s of trading*
7pt Trading compass:
Price action, entry/exit
Volume average/direction
Trend, patterns, momentum
Newsworthy current events
Revenue
Earnings
Balance sheet
7 Common mistakes:
+5% portfolio trades, capital risk management
Beware of analyst's motives
Emotions & Opinions
FOMO : bad timing, the market is ruthless, be shrewd
Lack of planning & discipline
Forgetting restraint
Obdurate repetitive errors, no adaptation
7 Important tools:
Trading View app!, Brokerage UI
Accurate indicators & settings
Wide screen monitor/s
Trading log (pencil & graph paper)
Big, organized desk
Reading books, playing chess
Sorted watch-list
Checkout my indicators:
Fibonacci VIP - volume
Fibonacci MA7 - price
pi RSI - trend momentum
TTC - trend channel
AlertiT - notification
tickerTracker - MFI Oscillator
www.tradingview.com

US Equity Market 2022 TimelineUS Equity Market 2022 Timeline based on the 1-day chart 730SMA TTC - trend channel to get a very accurate trajectory over time. Plus, tickerTracker - MFI Oscillator set to 45 with VTI, DIA, SPY, QQQ and IWM.
LEAPS 1/21
FOMC 1/26
MONTHLY 2/18
FOMC 3/16
QUAD WITCHING 3/18
FOMC 4/27
FOMC 6/16
QUAD WITCHING 6/17
FOMC 7/27
QUAD WITCHING 9/16
FOMC 9/21
FOMC 10/1
FOMC 12/14
QUAD WITCHING 12/16
LEAPS 1/20/2023
Holiday Market Closed:
1/17
2/21
4/15
5/30
6/20
7/4
9/5
11/24
11/25 1pm
12/26
1/2/2023
1/16/2023
Do your own due diligence, your risk is 100% your responsibility. This is for educational and entertainment purposes only. You win some or you learn some. Consider being charitable with some of your profit to help humankind. Good luck and happy trading friends...
*3x lucky 7s of trading*
7pt Trading compass:
Price action, entry/exit
Volume average/direction
Trend, patterns, momentum
Newsworthy current events
Revenue
Earnings
Balance sheet
7 Common mistakes:
+5% portfolio trades, capital risk management
Beware of analyst's motives
Emotions & Opinions
FOMO : bad timing, the market is ruthless, be shrewd
Lack of planning & discipline
Forgetting restraint
Obdurate repetitive errors, no adaptation
7 Important tools:
Trading View app!, Brokerage UI
Accurate indicators & settings
Wide screen monitor/s
Trading log (pencil & graph paper)
Big, organized desk
Reading books, playing chess
Sorted watch-list
Checkout my indicators:
Fibonacci VIP - volume
Fibonacci MA7 - price
pi RSI - trend momentum
TTC - trend channel
AlertiT - notification
tickerTracker - MFI Oscillator
www.tradingview.com

Macroeconomic stuffSince 3/15/2020 total FOMC Quantitative Easing (+$8,970,000,000,000) + Congress Stimulus (+$4,500,000,000,000). Now, in 2022 FOMC Quantitative tightening started (-$95,000,000,000/month) & Congress stopped stimulus in mid 2021. This equals a macroeconomic liquidity event on the way up and on the way down. Here's a 15-year VTI chart with US market cap figures on the top and US GDP numbers on the bottom of the long-term trajectory trend channel:
IMF 2022 GROWTH PROJECTIONS
COUNTRY 2022 REAL GDP FORECAST
INDIA 8.2%
SAUDI ARABIA 7.6%
SPAIN 4.8%
CHINA 4.4%
AUSTRALIA 4.2%
UAE 4.2%
SINGAPORE 4.0%
CANADA 3.9%
UNITED STATES 3.7%
UNITED KINGDOM 3.7%
NIGERIA 3.4%
FRANCE 2.9%
SOUTH KOREA 2.5%
JAPAN 2.4%
ITALY 2.3%
GERMANY 2.1%
MEXICO 2.0%
SOUTH AFRICA 1.9%
BRAZIL 0.8%
RUSSIA -8.5%
UKRAINE -35.0%
Do your own due diligence, your risk is 100% your responsibility. This is for educational and entertainment purposes only. You win some or you learn some. Consider being charitable with some of your profit to help humankind. Good luck and happy trading friends...
*3x lucky 7s of trading*
7pt Trading compass:
Price action, entry/exit
Volume average/direction
Trend, patterns, momentum
Newsworthy current events
Revenue
Earnings
Balance sheet
7 Common mistakes:
+5% portfolio trades, capital risk management
Beware of analyst's motives
Emotions & Opinions
FOMO : bad timing, the market is ruthless, be shrewd
Lack of planning & discipline
Forgetting restraint
Obdurate repetitive errors, no adaptation
7 Important tools:
Trading View app!, Brokerage UI
Accurate indicators & settings
Wide screen monitor/s
Trading log (pencil & graph paper)
Big, organized desk
Reading books, playing chess
Sorted watch-list
Checkout my indicators:
Fibonacci VIP - volume
Fibonacci MA7 - price
pi RSI - trend momentum
TTC - trend channel
AlertiT - notification
tickerTracker - MFI Oscillator
www.tradingview.com

US equity market checkVTI is an ETF that includes the entire US equity market with 4,128 holdings. It's a great way to check the general overall tone of the United States stock markets. Here we have a 1 week chart, 4 year view, with my MTTC2.0 (still in beta) 17 levels set to SMA4 +-1% deviation per level, with the slow moving average envelope set to SMA50 with a +-8% deviation support & resistance. Technically, the US equity market (VTI) is very close to global support at $211.41 and $208.49 which is local support. The average of the two = $209.95, so if VTI gets to that level a logical technical plan would be to flip put hedges and go long with all calls until it gets back to pivot and then back to a 1 : 1 balanced hedge ratio. By my estimation that day is imminent as early as Monday or Tuesday 4/25 or 4/26. This past Friday was close, lol.
Do your own due diligence, your risk is 100% your responsibility. This is for educational and entertainment purposes only. You win some or you learn some. Consider being charitable with some of your profit to help humankind. Good luck and happy trading friends...
*3x lucky 7s of trading*
7pt Trading compass:
Price action, entry/exit
Volume average/direction
Trend, patterns, momentum
Newsworthy current events
Revenue
Earnings
Balance sheet
7 Common mistakes:
+5% portfolio trades, capital risk management
Beware of analyst's motives
Emotions & Opinions
FOMO : bad timing, the market is ruthless, be shrewd
Lack of planning & discipline
Forgetting restraint
Obdurate repetitive errors, no adaptation
7 Important tools:
Trading View app!, Brokerage UI
Accurate indicators & settings
Wide screen monitor/s
Trading log (pencil & graph paper)
Big, organized desk
Reading books, playing chess
Sorted watch-list
Checkout my indicators:
Fibonacci VIP - volume
Fibonacci MA7 - price
pi RSI - trend momentum
TTC - trend channel
AlertiT - notification
tickerTracker - MFI Oscillator
www.tradingview.com

VTI 1 hour chartHere's a VTI 1 hour chart, 3 month view, with Pivots HL, MTTC2.0 (beta) & tickerTracker MFI Oscillator indicators. Pivots HL is set to 13, MTTC2.0 is set to 32 and tickerTracker is set to 26. The tickers input are VTI (white), SPY (orange), QQQ (blue), IWM (yellow), DIA (red), cryptocap TOTAL (green). Here's support & resistance levels on the 1hr chart:
R3 = $226.48
R2 = $224.48
R1 = $222.08
pivot = $219.88
S1 = $217.68
S2 = $215.48
S3 = $213.28
Do your own due diligence, your risk is 100% your responsibility. This is for educational and entertainment purposes only. You win some or you learn some. Consider being charitable with some of your profit to help humankind. Good luck and happy trading friends...
*3x lucky 7s of trading*
7pt Trading compass:
Price action, entry/exit
Volume average/direction
Trend, patterns, momentum
Newsworthy current events
Revenue
Earnings
Balance sheet
7 Common mistakes:
+5% portfolio trades, capital risk management
Beware of analyst's motives
Emotions & Opinions
FOMO : bad timing, the market is ruthless, be shrewd
Lack of planning & discipline
Forgetting restraint
Obdurate repetitive errors, no adaptation
7 Important tools:
Trading View app!, Brokerage UI
Accurate indicators & settings
Wide screen monitor/s
Trading log (pencil & graph paper)
Big, organized desk
Reading books, playing chess
Sorted watch-list
Checkout my indicators:
Fibonacci VIP - volume
Fibonacci MA7 - price
pi RSI - trend momentum
TTC - trend channel
AlertiT - notification
tickerTracker - MFI Oscillator
www.tradingview.com

Moving on Up!back to all-time highs, vix is back down, and I think Ukraine is small potatoes and will resolve itself in Q2.

US Equity market perspectiveUS Equity market perspective 2018 - present. This is a VTI 1 day chart with my personal Mega Triangular Trend Channel set to SMA365 and a 4-level trend channel inlay set to EMA200. This perspective can be used by a long-term investor to plan capital deployment and/or risk management. I set my tickerTracker MFI oscillator to 100 with VTI, SPY, QQQ, IWM, DIA etf's and SQQQ, SRTY, VXX, SDOW market hedge etf's. I published this zoomed out so it may appear scrunched up, but if you zoom in it's a very helpful perspective to see.
VTI
SPY
QQQ
IWM
DIA
SQQQ
SRTY
VXX
SDOW
Do your own due diligence, your risk is 100% your responsibility. This is for educational and entertainment purposes only. You win some or you learn some. Consider being charitable with some of your profit to help humankind. Good luck and happy trading friends...
*3x lucky 7s of trading*
7pt Trading compass:
Price action, entry/exit
Volume average/direction
Trend, patterns, momentum
Newsworthy current events
Revenue
Earnings
Balance sheet
7 Common mistakes:
+5% portfolio trades, capital risk management
Beware of analyst's motives
Emotions & Opinions
FOMO : bad timing, the market is ruthless, be shrewd
Lack of planning & discipline
Forgetting restraint
Obdurate repetitive errors, no adaptation
7 Important tools:
Trading View app!, Brokerage UI
Accurate indicators & settings
Wide screen monitor/s
Trading log (pencil & graph paper)
Big, organized desk
Reading books, playing chess
Sorted watch-list
Checkout my indicators:
Fibonacci VIP - volume
Fibonacci MA7 - price
pi RSI - trend momentum
TTC - trend channel
AlertiT - notification
tickerTracker - MFI Oscillator
www.tradingview.com


VTI vs SECompare VTI with SE from Jan 2021 to March 2022.
I\People who invested in SE did see much unrealized in 2021

The battle of two wolves“There is a battle of two wolves inside us all. One is evil: it is anger, envy, greed, arrogance, jealousy, resentment, lies. The other is good: it is joy, peace, love, hope, humility, kindness, empathy, truth. The wolf that wins? The one you feed. —Cherokee proverb”
VTI total US stock market etf with SMA200 mega trend channel (SMA200 is center green), SMA50 bull/bear trendline, 50 day H&L pivot price print & tickerTracker MFI oscillator set to 50 with VTI, SPY, QQQ, IWM & DIA. March 23rd, 2020, was the bottom of the Covid market drop. There will be a bottom and a bullish reversal at some point. Within the next 24hrs-3 days this is a screaming buy for investors.
Hello dear traders. It's bittersweet profiting on short trades under these circumstances. Meaning I thought hedging with puts was smart since the beginning January downtrend. But now since Feb 17th profiting on puts because of wacko Vlad attacking the good Ukranian people just doesn't sit well with me. It feels off, kind of unethical. If you want to short something short oil people or at least trim your position and find profit elsewhere. I think it'd be fantastic if traders & investors flip the script and go long soon any day now steady uptrend till at least 3/16 FOMC. lol.
Showing solidarity and bravery against this geopolitical crap. Everyone's chicken out there trading out of fear. I know that I have to listen to the market and trade accordingly for precision to consistently profit. But I'm over it personally by feelings I'm saying. Anyways, not to write a philosophical decertation. But for example, everyone piling into oil driving the price up exponentially is stupid for society, yet a smart easy profitable trade. What are your thoughts about this juxtaposition of trading for obvious profit in conflict with what's good social behavior?
It's really the Wallstreet fat cats, Hedge funds, Institutional investors & Fund managers who are pushing the market movements. We retail traders just have to react and trade accordingly for profit. It sure would be great to see a bullish reversal within the next few days. I'll be paying close attention as always and trade on technicals when fundamentals are not in play, yet reluctantly short anything except oil, RSX & RUB anymore. I'm calling on Wallstreet, Hedge funds, Institutional investors and Fund managers to change course ASAP.
Macroeconomic events 2/24:
8:30 Chicago Fed National Activity (Jan) Actual: 0.69 Previous: 0.07
8:30 Continuing Jobless Claims Actual: 1,476K Forecast: 1,580K Previous: 1,588K
8:30 Core PCE Prices (Q4) Actual: 5.00% Forecast: 4.90% Previous: 4.90%
8:30 GDP (QoQ) (Q4) Actual: 7.0% Forecast: 7.0% Previous: 6.9%
8:30 GDP Price Index (QoQ) (Q4) Actual: 7.2% Forecast: 6.9% Previous: 7.0%
8:30 GDP Sales (Q4) Actual: 2.0% Previous: 1.9%
0:30 Initial Jobless Claims Actual: 232K Forecast: 235K Previous:249K
8:30 Jobless Claims 4-Week Avg. Actual: 236.25K Previous: 243.50K
8:30 PCE Prices (Q4) Actual: 6.3% Previous: 6.4% Forecast: 5.3%
8:30 Real Consumer Spending (Q4) Actual: 3.1% Previous: 3.3%
Do your own due diligence, your risk is 100% your responsibility. This is for educational and entertainment purposes only. You win some or you learn some. Consider being charitable with some of your profit to help humankind. Good luck and happy trading friends...
*3x lucky 7s of trading*
7pt Trading compass:
Price action, entry/exit
Volume average/direction
Trend, patterns, momentum
Newsworthy current events
Revenue
Earnings
Balance sheet
7 Common mistakes:
+5% portfolio trades, capital risk management
Beware of analyst's motives
Emotions & Opinions
FOMO : bad timing, the market is ruthless, be shrewd
Lack of planning & discipline
Forgetting restraint
Obdurate repetitive errors, no adaptation
7 Important tools:
Trading View app!, Brokerage UI
Accurate indicators & settings
Wide screen monitor/s
Trading log (pencil & graph paper)
Big, organized desk
Reading books, playing chess
Sorted watch-list
Checkout my indicators:
Fibonacci VIP - volume
Fibonacci MA7 - price
pi RSI - trend momentum
TTC - trend channel
AlertiT - notification
tickerTracker - MFI Oscillator
www.tradingview.com
