Elliot Wave 1? we will seeHi all,
We are here analyzing VTI one of my favorite ETFs.
from the technical I can see a wave 1 elliot so we should expect a fall at least up to level 61.8 to then return to the upside
VTS trade ideas

ATH breakoutRecently broke out of it's all time high, might consolidate a bit to let the moving average catch up before rallying again.


Market Direction AnalysisIf weekly close is above inner-most volatility band - Market is in a Bullish Trend
If weekly close is inside the inner-most volatility band - Market is in a Transition
If weekly close is bellow the inner-most volatility band - Market is in a Bearish Trend
Credit: Mike Turner

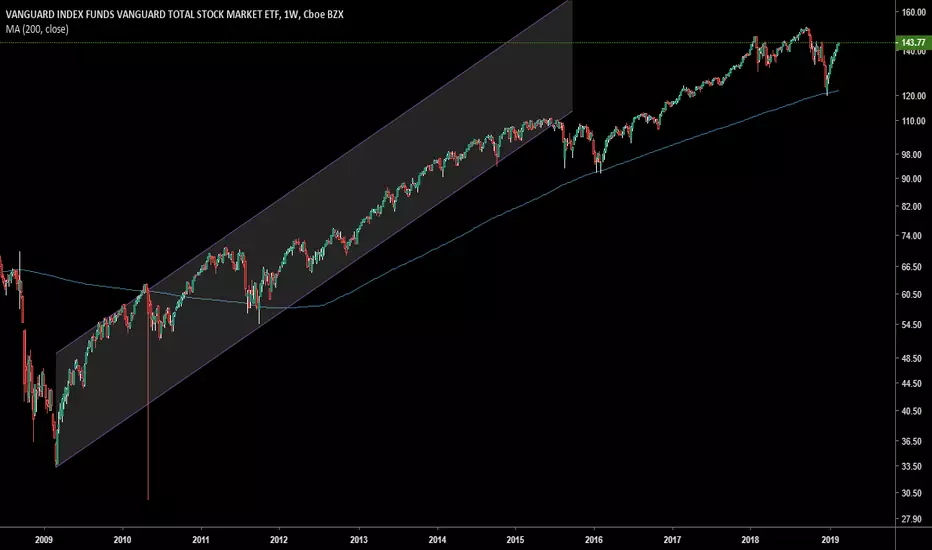
VTI - Trend line on log scalealternative approach at
The Vanguard Total Stock Market ETF (NYSEARCA: VTI) tracks the performance of the CRSP U.S. Total Market Index. The fund has returned 6.23% since its inception in 2001. The fund is a market capitalization-weighted index that measures the entire investable U.S. equities market. It includes small-, mid- and large-cap companies. The fund is managed in a passive manner and uses an index-sampling strategy.

Possible 25% retracement of US stock in next 12-24 monthsThe Vanguard Total Stock Market ETF (NYSEARCA: VTI) tracks the performance of the CRSP U.S. Total Market Index. The fund has returned 6.23% since its inception in 2001. The fund is a market capitalization-weighted index that measures the entire investable U.S. equities market. It includes small-, mid- and large-cap companies. The fund is managed in a passive manner and uses an index-sampling strategy.

trenline breaks dont mean THAT MUCHas shown here the last'decisive trendline break' ushered in a correction then the trend continued. calling for a trend reversal off this vti log scale is in my opinion premature. the obly thing that changed from the xmas massacre and this year is the calendar, none of the reasons for the selloff have changed yet , since the calendar, switched we have gone straight up. i say dec was exclusively low volume algo tax harvesting
Recovery into 2019, Then RecessionNot financial advice but I'm hoping that the market will rebound into "recovery" until April to about $139 for $VTI, then I'm liquidating out with an eye on global markets bottoming out with $VTI around $66 in Q1 of 2020.
I'm not a fiduciary, not an economist, not a professional trader. Don't listen to me. Just posting this for personal tracking.

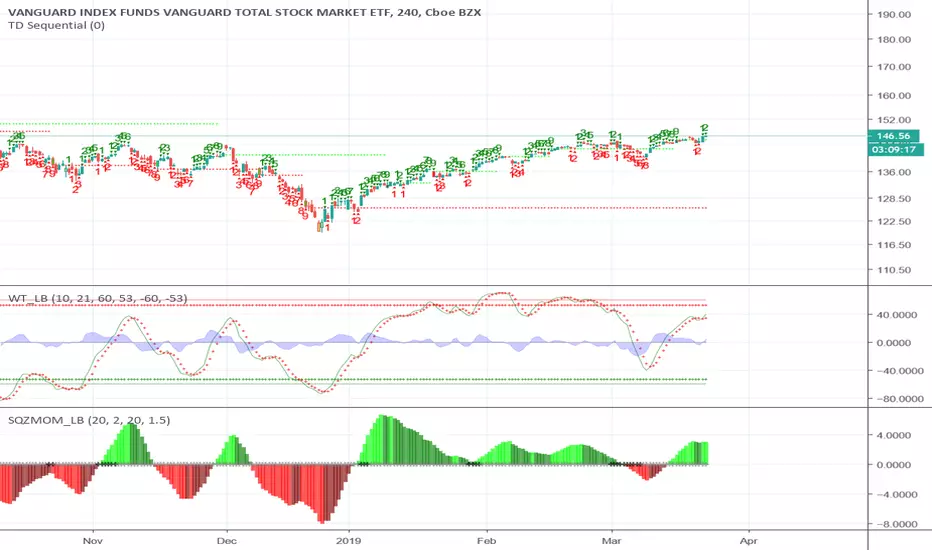
VTI ETFAppears to be in a rising wedge, RSI appears pretty bullish working it's way back up to the levels of last January in under a month. MACD is ripping upward and may not see resistance until closer to January 30th (give or take a day). Elliot Wave has just turned positive as well as the 50 day SMA. Need more time for confirmation, however I'm bullish on this until it reaches the black line at about 144 which could be a potential resistance reaching back to late January of 2018, most recently you will find this on the H&S/Triple Top between October 17 and December 3.
I don't own this ETF and this is purely from the perspective of a speculator. DYOR.

Custom Market Cap Index LOWPay attention to this chart because I can't stress enough how important it is to understand price boundaries and ranges. This chart is a measurement of price elasticity in relation to the VIX and historically has shown that any price decrease where this Index falls to below $3.50 is, typically, a setup of a major price bottom. At this point, I urge all traders to be cautious of rotation and risk, but to start looking for opportunities in early 2019 because I believe this downside move has reached an overextended range and is about to end. My other predictive modeling systems are suggesting the US markets could rally extensively in early 2019 while Gold pauses above 1300.
Therefore, be prepared. This could be one of the best short term LONG setups we've seen since 2015/2016.

Testing the new long term channelIf the market bounces from the low in the new channel, it might be bounce into a new high. If it drops back into its old channel, we might see lower lows. The bull market isn't broken long term.


Divergence crashLarge divergence in price and momentum leading up to the 2007-2009 crash. Same is repeating, only much bigger right now.

Custom Market Cap Index shows the US stocks will trend higherThis custom Market Cap Index is something I used to gauge market conditions and capability with regards to trends, peaks, bottoms and more. You can see that is ranges price volatility quite well and allows me to see what the market is capable of doing over the next few weeks and months.
Right now, the US stock markets have quite a bit of upside price range to go. Don't be surprised if the US stock markets continue to rally over the next 3+ weeks and then stall out for the remainder of the fall season. Increased volatility may come in early November or December as my cycle indicators show volatility should increase near this time.
Pay attention to my posts. You may find my work is far deeper and more advanced than simple trading triggers. I've just predicted what will happen over the next 4~5 months with a relative degree of certainty.
Follow me to learn more and I'll share even more resources with you.

Short on VTIBroad index's will always mean-revert. If we look at the 750 MA or 1250 MA, prices have been blowing up thanks to the US policies and big companies' growth. Prices seem to not be able to break above their all-time high, yet, everyone seems to be buying at any pullback opportunity.
This ETF will be going down by at least 5-10%. Once it has, it will become a very attractive buy; the US economy is good and the companies are flooded with cash; people want to get in on that... at the right price.


US Market OverboughtFollowing the trend lines shows deeper correction in next 3-5 months.
I'd say next earnings season (June-July) will be the spark.

Where is the US stock market headed?I've done ideas on the DJIA and the SPX, but I haven't really looked at the entirety of the US market. My prediction is in the chart. I put my thoughts on why it would go down on my ideas on the indices. I think it'll be a mix of political factors (Trump's idea of tariffs), people moving to bonds, and overall fear of the market as it has stayed bullish so long.
Tell me what you think below,
-Kristian

VTI: Ascending Wedge, Bearish Harami, bearish IndicatorsA late push by VTI changed a bearish Engulfing to a bearish Harami.
