S&P/ASX 200 Financials • 1st Quarter PerformanceSince 2000, the S&P/ASX 200 Financials has ended December above its 200-day moving average on 11 previous occasions. December 2021 marked the 12th observation. Following this, XFJ had a tendency to rise in the 1st Calendar Quarter of the Year, providing an average 3-month gain of 5.71% & a win rate
Related indices


ASX Financial aka Banks IndexASX Financial aka Banks Index looks good from here if holds the fib golden ratio and trend support. Yummy divys coming

XFJ ASX 200 FINANCIALS - TAThe Index prices have fallen below the wedge price pattern in the daily price chart and heading down towards 6168 a critical support price point which acted as a good support level in the past. Failure to hold at this level could see the index prices fall further to around 6109-5986

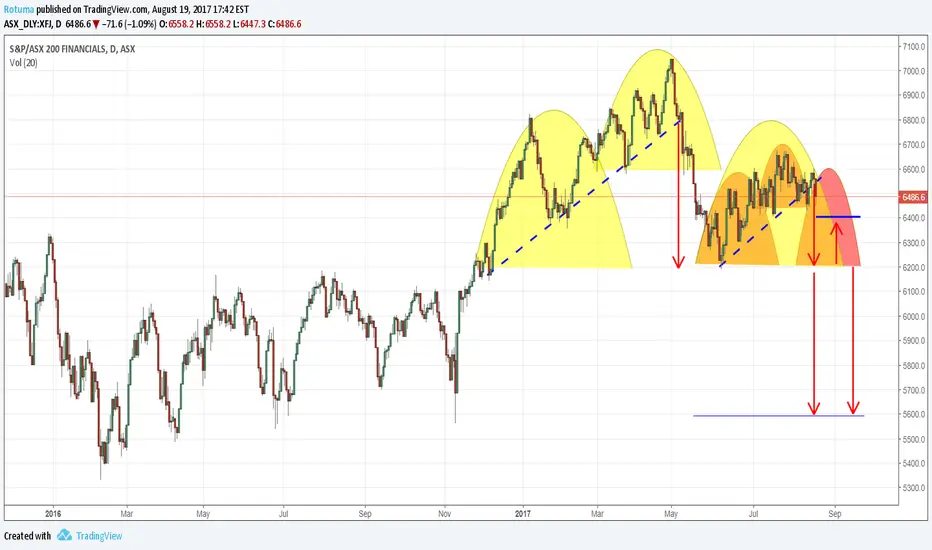
Are we there yet? ASX Financial XFJ is on its final stage ASX Financial XFJ Index could be on its 3rd and final stage of a pull back. The attached chart reveals that we have a double head and shoulder price formation within the same price range. The Index closed at 6486.6 on Friday 18-8-17 down by -1.09% outside an upward price channel formed in the beginn

See all ideas
Summarizing what the indicators are suggesting.
Oscillators
Neutral
SellBuy
Strong sellStrong buy
Strong sellSellNeutralBuyStrong buy
Oscillators
Neutral
SellBuy
Strong sellStrong buy
Strong sellSellNeutralBuyStrong buy
Summary
Neutral
SellBuy
Strong sellStrong buy
Strong sellSellNeutralBuyStrong buy
Summary
Neutral
SellBuy
Strong sellStrong buy
Strong sellSellNeutralBuyStrong buy
Summary
Neutral
SellBuy
Strong sellStrong buy
Strong sellSellNeutralBuyStrong buy
Moving Averages
Neutral
SellBuy
Strong sellStrong buy
Strong sellSellNeutralBuyStrong buy
Moving Averages
Neutral
SellBuy
Strong sellStrong buy
Strong sellSellNeutralBuyStrong buy
Displays a symbol's price movements over previous years to identify recurring trends.