S&P/ASX 200 Financials • 1st Quarter PerformanceSince 2000, the S&P/ASX 200 Financials has ended December above its 200-day moving average on 11 previous occasions. December 2021 marked the 12th observation. Following this, XFJ had a tendency to rise in the 1st Calendar Quarter of the Year, providing an average 3-month gain of 5.71% & a win rate of 10 from 11 events.
Disclaimer: This data is not financial advice. Data is for educational & informational purposes only & should not be used to make any investment decisions. No representation or warranty is given as to the accuracy or completeness of this information. Past performance is not a guide to future performance & may not be repeated.
XFJ trade ideas


ASX Financial aka Banks IndexASX Financial aka Banks Index looks good from here if holds the fib golden ratio and trend support. Yummy divys coming

XFJ ASX 200 FINANCIALS - TAThe Index prices have fallen below the wedge price pattern in the daily price chart and heading down towards 6168 a critical support price point which acted as a good support level in the past. Failure to hold at this level could see the index prices fall further to around 6109-5986

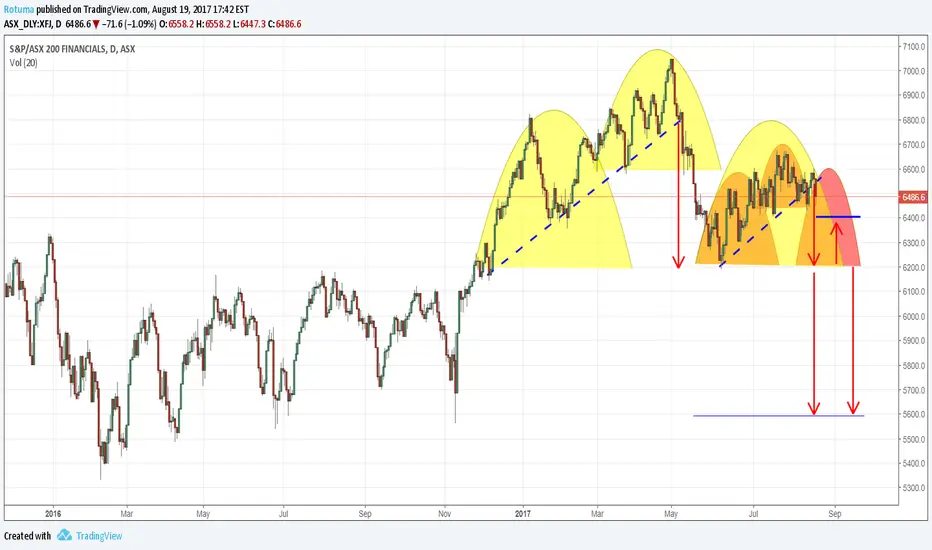
Are we there yet? ASX Financial XFJ is on its final stage ASX Financial XFJ Index could be on its 3rd and final stage of a pull back. The attached chart reveals that we have a double head and shoulder price formation within the same price range. The Index closed at 6486.6 on Friday 18-8-17 down by -1.09% outside an upward price channel formed in the beginning of May this year. The index price is looking very likely to head down to 6200 if it fails to stay above 6400 resistance price level. There is a possibility that it could fall further to 5600 if it fails to hold at 6200 support price level