ASX:XMM - Keep a close watch on sector and companiesASX:XMM - Keep a close watch on sector and companies
~The sector is in an uptrend after making a bottom in Jan 2016
~the previous high was made in Nov 2008
~after a gap of close of 13-14 years sector has come to the limelight.
~Strong global demand
~China demand for minerals
~ Global infrastructure post-COVID-19 - Govt push
~DON't forget over 50% of the consumption of iron ore is from infrastructure
~Iron ore consumption worldwide increasing steadily
~ ASX listed companies in my watch list.
1. $BSL
2. $CHN
3. $DEG
4. $ILU
Trend analysis
Fundamental analysis
Beyond technical analysis
XMM trade ideas

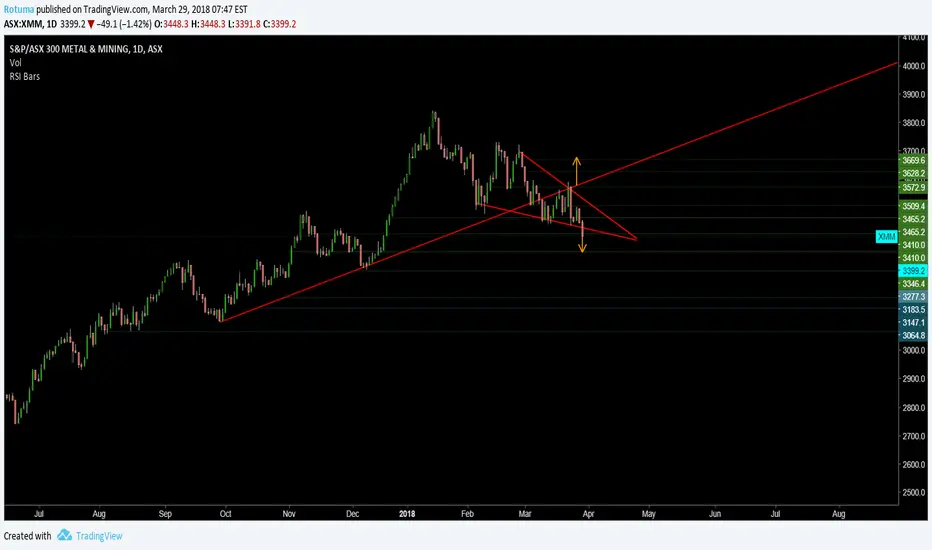
S&P/ASX 300 METAL& MININGThis is an update of my previous post on 23-3-2018.just added some extra support resistance and trendlines to the chart. The Index is heading into Bear territory after breaching two critical support price points in the last two trading session. There are three price points that I would like to point out for future references.
1. 3465 - a major resistance price point that needs to break before any moves to the upside
2. 3346 - this is the next support price point if it fails to head back up above 3410
3. 3277 - the next support if it fails at 3346
There are other support and resistance below 3277 marked on the chart but will only look at it if its necessary.
XMM S&P ASX 300 METAL & MININGThe Index is currently down by 3.64% trading below 3465 and looks to be heading down to 3410 support. The next support is at around 3346 if it fails to hold at 3410.
There are two critical price points to keep an eye on
1. 3465 - This is a critical price point where prices need to get back up here and hold before determining the next move
2. 3572 - A break above this price point would provide some confidence that might drive the index price further up.


ASX 300 Metal & Mining Index is holding its ground at 3093
ASX 300 Metal & Mining Index closed on Friday 18-8-17 at 3093 a critical support price point which had four consecutive failed attempts in the past five months and was recently successful on 4/8/17 but after seven trading days it is showing signs of weakness to maintain its trading activities above 3093.
Three things could happen in the coming weeks.
1. The Index price could hold its ground and continue its up trend
2. It could fall below 3093 and head down to 2950 and bounce back to around 3090
3. The Index price could drop to 2950, fail to hold and continue its downward trend to around 2743
