XRF Heading lowerUsing Volume Profile analysis to show where the XRF price can be heading after such a great run in April.
During consolidation period followed by a move higher, the price pulled back toward the previous Point of Control (POS) before the position was defended and price bounced off before moving higher.
Prior to the big move up on 14-Apr, the POC was clearly building around the 1 - 1.03 level. If it falls below the 1.15 level which happens to be the 0.618 Fib level as well, it will most likely fall back to around the 1.00 level as there is a low volume profile region below 1.15.
My expectation is that this position around 1.00 will be defended as the fundamentals for the company remains strong. This could also be a good entry point for those who missed the initial run up.
XRF trade ideas

XRF @ 27 OCT 2021Text me if you have any questions/comments for me.
-----
XRF
- Previous analysis was done on 23 Sep (red arrow) -> suggested waiting for stock to retrace and rebound successfully
- Since then, the stock retraced strongly to test the mid-term support
- The subsequent rebound was not successful and formed a LH
- Stock tested the short-term support again and today closed at the 0.67 resistance levels (orange line)
- A counter-trendline (blue dash line) shows that today’s price action has closed above
- A successful breakout looks to be around 0.69 levels
- R is borderline 10%
- Strategy-to-buy (DYOR) – Suggest waiting for stock to successfully breakout before plotting entry

XRF @ 23 SEP 2021Text me if you have any questions/comments for me.
-----
XRF
- Previous analysis was done on 14 Sep -> suggested waiting for stock to retrace and rebound successfully
- Stock recently had a minor retracement and rebounded
- On 30 Aug, suggested entry at 0.54 levels if believe the stock can create new highs
- Since then, the stock has risen 24% in less than 4 weeks
- If you missed the suggested entries, current price is no longer suitable for entry
- Price is currently too far from the short-term support
- R is more than 10%
- Strategy-to-buy (DYOR) – Suggest waiting for stock to retrace and rebound successfully

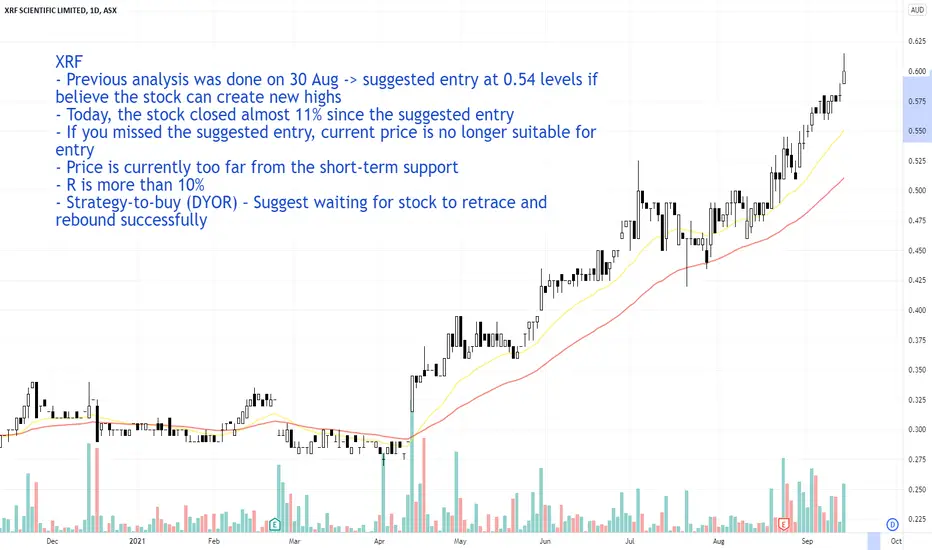
XRF @ 14 SEP 2021XRF
- Previous analysis was done on 30 Aug -> suggested entry at 0.54 levels if believe the stock can create new highs
- Today, the stock closed almost 11% since the suggested entry
- If you missed the suggested entry, current price is no longer suitable for entry
- Price is currently too far from the short-term support
- R is more than 10%
- Strategy-to-buy (DYOR) – Suggest waiting for stock to retrace and rebound successfully
-----
Text me if you have any questions for me.
XRF @ 30 August 2021XRF
- First time doing a written analysis on XRF
- Uptrend started since mid-April 2021 -> doesn’t have a long history of good uptrend
- Has a series of HHs and HLs but could be more significant
- Trading at all-time high regions
- Stock is currently a bit far from the short-term support
- R is less than 10%
- Strategy-to-buy (DYOR) – Entry at current price if believe the stock can continue to form new highs

$XRF -breakout from 6 week continuation base. Look for high flag50c capper was taken out this afternoon. depth is a bit ordinary on this thing at times, but the chart and key resistance levels are working well. See if it wants to test 52/53 and then rest before a move?
XRF’s technology is used to measure the composition and purity of materials and is mainly applied in
industrial quality control and in process control for manufacturing processes in industries such as metals
and mining, construction materials, chemicals and petrochemicals.

$XRF volume in the right spot. 50.5 break?I entered this too early, idiot brain kicked in. But this time looks a little bit more evidence to support the premise its ready for a continuation move.
Take out the capper and maybe its away.


$XRF - high flag/cup and handle setting up?I missed the breakout and really liking this action here. I think the thing to look for here is a little tighten up.

