AKTOR HOLDING – Bullish Breakout with Strong MomentumPrice Action Overview
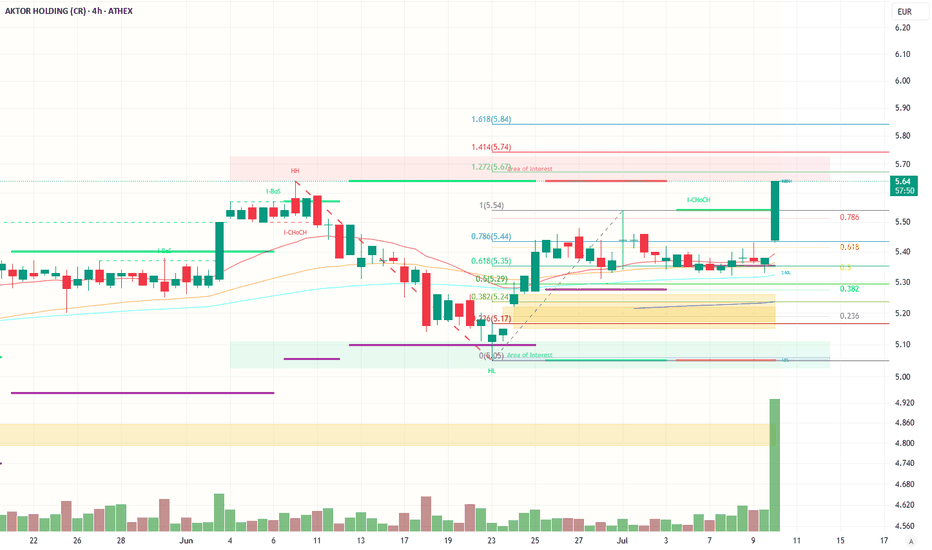
The stock is currently trading at €5.63, up +4.65%, with a strong bullish candle and a significant increase in volume, suggesting strong buying interest.
A clear bullish breakout has occurred from a consolidation zone near the €5.30–€5.40 range.
Key Fibonacci Levels
From the Fibonacci retracement drawn:
The stock retraced to the 0.0 level (€5.05) and formed a higher low (HL)—this is a bullish signal.
After reclaiming the 0.618 retracement level (€5.35) and 0.786 (€5.44), the stock has broken above the previous high (€5.54), confirming bullish momentum.
Extension Levels:
1.272: €5.67 – recently surpassed.
1.414: €5.74 – short-term resistance.
1.618: €5.84 – potential mid-term target if the trend continues.
Market Structure
I-CHoCH (Internal Change of Character) marked after a pullback.
Followed by CHoCH (Change of Character) confirms the transition from bearish to bullish trend.
Strong higher low (HL) and new higher high (HH) structure visible.
Support & Resistance
Immediate resistance: €5.67 (1.272 Fib extension), then €5.74 and €5.84.
Support: €5.44 (0.786 Fib), then €5.35 (0.618 Fib), and major support at €5.05 (previous swing low and area of interest).
Volume Analysis
Sharp volume spike on the breakout candle is very bullish. This indicates institutional or strong retail participation.
The volume confirms the validity of the breakout.
Trend Indicators
Moving averages (likely EMA20, EMA50, EMA100 based on color) are sloping upward.
Price has decisively broken above all key MAs, indicating a strong uptrend.
Bias: Bullish.
Near-term target: €5.74 (1.414 extension), possibly €5.84.
A pullback to €5.44–€5.54 could offer a buy-the-dip opportunity.
A break and close above €5.74 would open the way for continuation to €5.84 and beyond.
