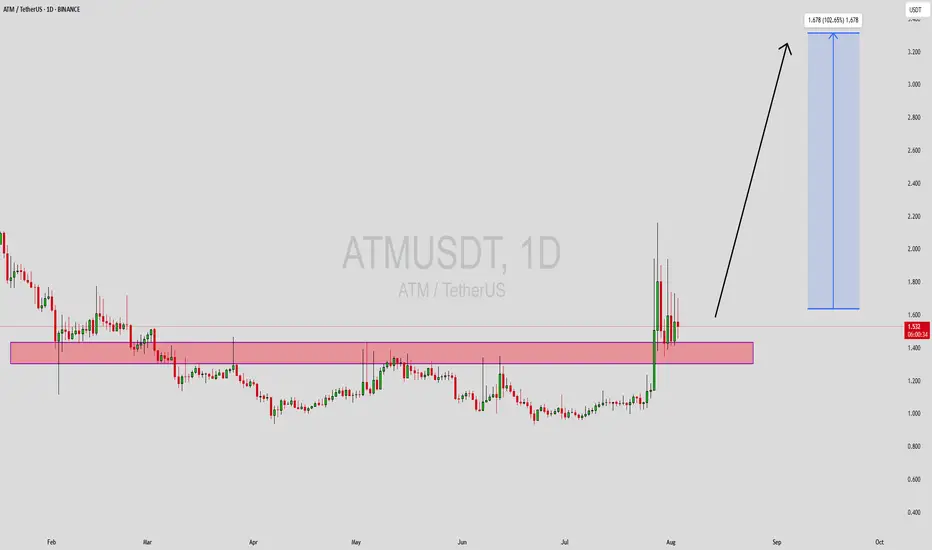
ATMUSDT Forming Bullish ContinuationATMUSDT is displaying a strong bullish continuation signal following its recent breakout from a prolonged consolidation zone. The price has surged above a critical resistance range, now turned into a support zone (highlighted in pink), which held the price down for months. This shift in structure signals renewed bullish sentiment, with price action stabilizing just above the breakout area — a textbook sign of accumulation before the next leg upward.
The trading volume accompanying this breakout is notably strong, reinforcing the legitimacy of the move. With an expected gain of 90% to 100%+, the current market structure suggests there's still substantial upside potential. The projection points to a move towards the $3.20 area, aligning with previous high-volume sell zones. If bulls maintain control and the price remains above the new support zone, this target becomes increasingly realistic in the short-to-mid term.
Investors are beginning to show strong interest in ATM, which is likely due to both technical and fundamental reasons. As the crypto market regains momentum, low-cap or mid-tier altcoins with solid breakout structures tend to outperform. The chart setup on ATMUSDT is appealing to both swing traders and breakout traders who are targeting high-reward scenarios with proper risk control.
ATMUSDT is a coin to watch closely. Any retest of the support zone could be a solid entry opportunity for those who missed the initial breakout. As long as the structure holds, this setup remains bullish and could offer one of the most rewarding trades on Binance’s spot market in the coming weeks.
✅ Show your support by hitting the like button and
✅ Leaving a comment below! (What is You opinion about this Coin)
Your feedback and engagement keep me inspired to share more insightful market analysis with you!
ATMUSDT trade ideas
Probable bull run on fantokens. Attention to ATM and ASRAgainst the background of the current market situation, when the seasonal growth cycle is over and most large-cap coins will be prone to flat with a fall along with the tops, and weak projects are awaiting a new announcement of the assignment of a monitoring tag, there are few interesting tools for speculators except for the most oversold coins on the market. In addition to the coins from the delisting announcement, which have already shown good pumps and may give additional X's before the actual delisting, fantokens that have been in the bear market for a long time are extremely oversold. The bearish trend is almost over and the ground has been formed for major breakouts. ATM ASRS currently have the highest targets with a growth potential of up to 150% with medium volatility and up to 4-5X with high volatility. Lazio porto alpine city acm can also be considered for work with a potential of up to 70-80% with medium volatility and up to 100-120 with high volatility.
In this article, I want to consider ATM, which is in the most interesting position along with ASR. The main zone of the set of positions is the range of 0.900-1.075, from where the successful exit occurred. In case of consolidation above the curves and the 1.25 level, we can expect a sharp increase in volatility and a trading range of 1.25-2.5. Breakouts on fantokens occur extremely sharply. The potential can be assessed using the example of the February JUV pulse. There is an opportunity for momentum before the end of this month, that is, at the beginning of the week. Then, until mid-May, there is a negative period in which there may be a reversal of the ether to 1500, which may lead ATM to retest the formed trend line, or a range of a set of positions. The minimum level for the current issue is the range of 0.5-6, which can be reached in the event of a break in the ether at 1250, which is still unlikely. As the middle of the month passes through to the beginning of June, buyer activity will begin to increase and new opportunities will appear for a return to the trend line in case of its breakdown downwards, as well as for momentum. The main goal is to retest the range 2.1-2.5. In the event of a breakdown of the key 2.5 level, there is an opportunity for additional volatility growth up to the test of levels 5 and 7.5.
I would like to note that fantokens are extremely low-liquid and I do not recommend using a large position in the work due to the possible long accumulation before the breakdown, prolonged drawdowns in the absence of momentum in the buying season.

Atlético de Madrid Fan Token, How To Read Charts & 726% PPA small tidbit about trendlines; you can draw a trendline by matching two or more points from any set of sessions. The trendline doesn't have to be necessarily the last session nor the lowest or highest, there can be middle trendlines, internal trendlines and so on. As long as the trendline is supported by multiple reactions it works. These are arbitrary lines and it is for you to decide. Play around with it and what works for you overtime and based on results is the right method. Nobody can tell you what is right or what is wrong or how it is done. Right or wrong can be decided objectively based on actual results.
Here we have Atlético de Madrid Fan Token (ATM) and guess what? I knew it would go up.
This chart has the same price patterns as all the other Altcoins charts, and this is great because the bullish breakout confirms what I've been saying and also what is coming to the rest of the Altcoins market.
After a major low on the 7th of April, in this case an All-Time Low, ATMUSDT started to recover and is now trading four weeks green. Today, the fourth week closes and there is a strong bullish breakout taking place.
The ATL is the bottom and from the bottom we grow.
The market is changing from a sideways market leading to a final flush/liquidity hunt event, to a new bull market growth phase.
Total growth since the bottom was hit now reaches more than 50% coupled with rising volume. This confirms that the downtrend is over, the bearish move is over, the correction is over the bull market is starting now or started 4 weeks ago when the bottom was hit.
When prices are at their lowest, that is when the market is the most bullish.
When prices are high, the potential for a correction or retrace becomes strong. That is why we sell when prices are high and buy when prices are low.
The bottom is confirmed through price action (when the market goes bullish and starts growing) and based on resistance and support. Now that ATMUSDT moved above the 3-Feb. low which happened a long lower wick we can say that the bullish bias is confirmed. This leaves behind a rounded bottom pattern or a v shaped bottom.
Another signal that I mention frequently is the size of the bearish waves.
Left side, the big wave is a bearish impulse or downtrend.
Right side, the small wave is a final market flush before bullish growth.
The first one is a market move, phase/cycle.
The second one is a market reaction.
All these signals are meant to confirm that the bottom is in. Once we have confirmation that the bottom is in we know the market will grow so the next step is to find some targets. I already explained how to extract those in my FISUSDT publication. You can go to @MasterAnanda and use the search filter to find this publication and learn more if you are interested.
Here, ATMUSDT has so much more to grow.
I am mapping just two targets on the chart because I have to write and do the numbers manually and it is too much do them all, plus, you only need to hold strong until prices are up. When prices are high, collect profits (sell) and move on.
The market will always offer endless opportunities, specially if you buy and sell at the right place.
» The first target goes for 438% which is an easy target (blue) and the second one for 726% (red). Please keep in mind that this trading pair/token can go much higher.
Thank you for reading.
Follow if you enjoy the content.
Namaste.

ATMUSDT is bullish in 1h time farme as it broke rectangular boxATMUSDT is bullish in 1h time farme as it broke rectangular box

ATMUSDT: Potential for Movement and Key Demand ZoneI believe that Fan tokens could experience some significant movement in the near future. The demand zone I’ve identified looks promising and could act as a strong support area for a potential price reversal.
With growing interest in these tokens and market conditions aligning, this could be a key opportunity to watch. I’m keeping an eye on this demand zone for a potential entry point if the price reacts positively here.
Key Points:
Fan Tokens: Anticipating a possible surge in activity.
Demand Zone: A strong support area where price could reverse.
Watch For Entry: Looking for a reaction at this zone before considering entries.
If you think this analysis helps you, please don't forget to boost and comment on this. These motivate me to share more insights with you!
I keep my charts clean and simple because I believe clarity leads to better decisions.
My approach is built on years of experience and a solid track record. I don’t claim to know it all, but I’m confident in my ability to spot high-probability setups.
If you would like to learn how to use the heatmap, cumulative volume delta and volume footprint techniques that I use below to determine very accurate demand regions, you can send me a private message. I help anyone who wants it completely free of charge.
My Previous Analysis
🐶 DOGEUSDT.P: Next Move
🎨 RENDERUSDT.P: Opportunity of the Month
💎 ETHUSDT.P: Where to Retrace
🟢 BNBUSDT.P: Potential Surge
📊 BTC Dominance: Reaction Zone
🌊 WAVESUSDT.P: Demand Zone Potential
🟣 UNIUSDT.P: Long-Term Trade
🔵 XRPUSDT.P: Entry Zones
🔗 LINKUSDT.P: Follow The River
📈 BTCUSDT.P: Two Key Demand Zones
🟩 POLUSDT: Bullish Momentum
🌟 PENDLEUSDT.P: Where Opportunity Meets Precision
🔥 BTCUSDT.P: Liquidation of Highly Leveraged Longs
🌊 SOLUSDT.P: SOL's Dip - Your Opportunity
🐸 1000PEPEUSDT.P: Prime Bounce Zone Unlocked
🚀 ETHUSDT.P: Set to Explode - Don't Miss This Game Changer
🤖 IQUSDT: Smart Plan
⚡️ PONDUSDT: A Trade Not Taken Is Better Than a Losing One
💼 STMXUSDT: 2 Buying Areas
🐢 TURBOUSDT: Buy Zones and Buyer Presence
🌍 ICPUSDT.P: Massive Upside Potential | Check the Trade Update For Seeing Results
🟠 IDEXUSDT: Spot Buy Area | %26 Profit if You Trade with MSB
📌 USUALUSDT: Buyers Are Active + %70 Profit in Total
🌟 FORTHUSDT: Sniper Entry +%26 Reaction
I stopped adding to the list because it's kinda tiring to add 5-10 charts in every move but you can check my profile and see that it goes on..

ATM Price analysis. Target for Atletico Madrid fan tokenRead please details on a chart! BINANCE:ATMUSDT
If we will see hype around CHZ and fan tokens all main targets for this alt season marked on a chart with explanation
Would be good to see Money inflow on a W tf again based on Money Power indicator
And signal to buy on TradeOn indicator
Hope you enjoyed the content I created, You can support with your likes and comments this idea so more people can watch!
✅Disclaimer: Please be aware of the risks involved in trading. This idea was made for educational purposes only not for financial Investment Purposes.
---
• Look at my ideas about interesting altcoins in the related section down below ↓
• For more ideas please hit "Like" and "Follow"!

Long Trade Position ATMUSDTTest your analytical skills in the tradingview simulator with virtual money to become a professional. In spot trading, I will specify the entry points, loss limit and profit limit for you! The conditions for entering the trade and our strategy are as follows, when you notice that the market trend is increasing and at least two green candles close above the entry point in fifteen minutes, you can enter the trade from the beginning of the third green candle. Be patient and don't rush to enter! After the price reaches the first target, move your stop loss below the first profit limit so that if the price reverses, your trade will be closed with profit. Repeat the above strategy to continue the price targets shown on the chart. If the price reaches or falls below our loss limit before the above condition, entering this transaction is invalid because it must be re-analyzed and the new entry, loss and profit limits must be determined. Note that the market trend is formed with clever tricks by the market maker, so even the most powerful analyzes may be invalidated. The only thing we can do is to surf the waves and stick to our strategy so that while taking care of our capital, Let's make a profit. These exercises will make you experience profit and loss with virtual money in the real market and improve your analysis and personal strategy. Know your fear and greed and gradually control them so that your business becomes profitable and you suffer less loss.


ATMUSDT 3D LONG📈Hi all. Timeframe 3D. ATM is at strong support and has formed a triangle. The price is being squeezed. Increased buyer volume. I assume a powerful way out. Enter spot now and/or enter long on a breakout/retest of the trend. Marked goals and levels.

Atm exciting...Low market cap.
* What i share here is not an investment advice. Please do your own research before investing in any digital asset.
* Never take my personal opinions as investment advice, you may lose all your money.


ATM 4h chart AnalysisATM 4h chart Analysis
Targets are mentioned
W pattern is in play
Cheers Boost Follow

ATMUSDTI have taken a Short position on ATMUSDT, and this is my own idea. This trade is executed on Binance.

ATMUSDT- In Bearish ContinuationATMUSDT is making a bearish Flag supporting the continuation of bearish pattern. RSI indicator is also confirming that, as there is no divergence.

ATMUSDT- In Trend ReversalATNUSDT is making a double bottom and RSI indicator also showing divergence, indicating a trend reversal. Can take an entry by placing buy stop order on breaking of the neckline or can take instant entry of neck line is already broken.

ATM Long PositionAfter a very long-lasting downtrend, ATM (and possibly other fan tokens) will gain strength. A long trial to ATM with a long-term target of 14 dollars.

ATMUSDT potential bullish momentumThe recent price movement of ATMUSDT suggests potential bullish momentum. At the current price of $2.480, several indicators indicate an upward trend for this cryptocurrency:
1. Moving Averages: One commonly used indicator in technical analysis is the moving average. If the short-term moving average (e.g., 50-day) crosses above the long-term moving average (e.g., 200-day), it can be considered a bullish signal. This crossover may indicate that the trend is shifting upward.
2.Relative Strength Index (RSI): RSI is a momentum oscillator that measures the speed and change of price movements. An RSI above 70 suggests that an asset may be overbought, while an RSI below 30 suggests it may be oversold. If the RSI for ATMUSDT is trending upwards and approaching the overbought threshold, it can be seen as a bullish sign.
3.Volume Increasing trading volume can be an indication of growing interest and participation in the market. A surge in trading volume alongside a rising price often confirms a bullish trend.
4.Fundamental Developments:** It's crucial to consider any recent news or fundamental developments related to ATMUSDT. Positive news such as partnerships, adoption, or technological advancements can be strong drivers of price appreciation.
5.Support and Resistance Levels:** Analyzing key support and resistance levels on the price chart can provide insights into potential price movements. If ATMUSDT has broken through significant resistance levels and is holding above them, it may indicate a bullish breakout.

ATMUSD - Sideways Market TradesMade a mistake in my previous sideway trades, I should've taken 2 trades, one with a buy stop order and one with a sell stop order. This time I've made the appropriate changes, to further increase the probability of a profitable trade. All the remaining calculations are the same as I use before. Let's see how this one plays out.

ATMUSDTATMUSDT is in bearish phase potentially printing LH and LL.
There is no sign of reversal from here.
We wait and watch for the breakout of last LL.

ATMUSDTATMUSDT is in bearish phase potentially printing LH and LL.
No sign of trend reversal from here.
we wait and watch for the breakout of last LL>

ATMUSDT - Bearish TrendThere is a hope for downward trend because of HL and LL have been formed. Market can touch these marked levels.


GOAL!!! Atlético de Madrid Fan Token (ATM), a popular sports-based cryptocurrency, is currently experiencing a significant price shift, making it a topic of interest for crypto enthusiasts and traders. This in-depth analysis, based on a 1-hour time frame, aims to provide insights into the current market situation and its potential future directions.
Currently, ATM is priced at $2.667, marking a considerable rise of 23% over the past 24 hours. This surge aligns with the bullish market sentiment underlined by an array of indicators. The Relative Strength Index (RSI), a momentum oscillator used to gauge the speed and change of price movements, stands at 80 – nearing the threshold for overbought conditions. Meanwhile, the volume oscillator, a tool to track volume changes, indicates a healthy 25.5% rise, suggesting an increase in buying pressure. The Stochastic oscillator, another momentum indicator, records a score of 61, signifying continued buying momentum.
On-Balance Volume (OBV), which uses volume to predict price trends, currently stands at 22 million. This metric aligns with the positive market sentiment, indicating a high volume of positive volume pressure. The Moving Average Convergence Divergence (MACD), another trend-following momentum indicator, sits at 0.109, affirming the bullish trend.
Taking a look at the Bollinger Bands – which measure market volatility and provide relative definitions of high and low prices – ATM's upper, middle, and lower bands are located at $2.638, $2.282, and $1.926, respectively. Intriguingly, ATM's current price exceeds the upper band, hinting at possible overextension and potential price correction in the future.
Fibonacci retracement levels – used by traders to identify potential levels of support and resistance – are set at $2.2 (0 level), $2.124 (middle level), and $2.048 (1 level). These could provide potential pivot points for price reversals. Furthermore, market movements over the last few hours indicate that ATM's price peaked at $2.98 before retracting to its current level. This peak now forms a key resistance level.
Upon switching to the 4-hour time frame, it becomes evident that the 1.618 Fibonacci level closely aligns with the resistance at $2.92. This level, near the recent peak price, is worth monitoring for signs of a breakthrough or rejection.
In conclusion, while the bullish momentum is evident in the current market dynamics for ATM, the key resistance level of $2.98 presents a significant hurdle. A break above this level could signal further bullish momentum, potentially propelling ATM into a new price range. Conversely, a bounce off this resistance could lead to a consolidation phase or even a price decline, with the support level of $2.591 providing a potential floor. As always, traders should integrate these technical analyses with broader market trends and updates to form a well-rounded trading strategy.
