🔥 ATM Horizontal ChannelATM has been trading inside this channel for a month now. During the latest sell-off ATM hit the bottom of the channel, forming a double bottom in the process: a classical bullish pattern.
My take would be that ATM will continue to rise towards the top of the channel, potentially breaking out from it in the coming weeks if bullish pressure remains.
Happy trading!
ATMUSDT trade ideas


🆓Atletico Madrid Fan/USDT Analysis (12/4) #ATM $ATMThe 10$ zone is very strong now and the buying volume is very impressive now.
So I expect it will have a lot of big pumps in the next few days.
📈BUY
-Buy: 9.7-10.3$. SL B
📉SELL
-Sell: 17.6-18.4$. SL A
♻️BACK-UP
-Buy: 7.8-8.2$ if A. SL B
-Buy: 5.8-6.2$ if A. SL B
❓Details
Condition A : "If 1D candle closes ABOVE this zone"
Condition B : "If 1D candle closes BELOW this zone"

ATM Buy - TD9 -EntryThere is a possibility for a reversal here with this pattern/td seq setup
Atlético de Madrid Fan Token


🔥 ATM Channel BounceIn my last ATM signal I was practically making the same trade, take a look:
That particular trade hit all targets and the channel held strong. This trade is based on the idea that the channel will hold and that ATM will bounce off the lower support of the channel. Looking at recent ATM price action, the price seems a bit jumpy with the occasional pump. Make use of that fact by not placing your profit targets to far away.
Happy trading!

ATMUSDT (ATLETICO MADRID FAN TOKEN) - BULLISH SETUP ANALYSIS 🔎
- ATMUSDT is bounded in the ascending channel (AC).
- Price is testing the ascending channel support.
- Price action is printing a pennant (P) pattern.
- A pennant pattern is a trend continuation pattern.
- A bullish continuation pattern in this case.
- There's a breakout potential.
BUY ENTRY ⬆️
- Stop limit entry : breakout above the pennant pattern's inclined resistance.
- Limit entry : test of the pennant pattern's inclined support.
TARGETS 🎯
- Horizontal resistance level (R1).
- Horizontal resistance level (R2).
- Ascending channel resistance.
- Fibonacci extension levels.
SETUP INVALIDATION ❌
- Breakdown below the pennant pattern's inclined support.
- This breakdown will lead to a test of the ascending channel support.
- The ascending channel support is the next support zone.


ATMUSDT - Long - Potential 14.94%ATMUSDT - Long - Potential 14.94%
Exchanges: Binance
Signal Type: Regular (Long)
Entry Zone:
9.541 - 9.717
Take-Profit Targets:
1) 10.193
2) 11.262
Stop Targets:
1) 9.091
Trailing Configuration:
Entry: Percentage (0.0%)

ATMChances to see strong bull trend to the moon
If you are not a high risk trader, wait for price to break the channel upward


🔥 ATM Bullish Channel ReversalATM has been inside this channel for almost two months now, reversing every time the channel boundaries are hit. During yesterday's fall, ATM got quite close to the lower support of the channel, potentially hitting it soon. This trade is based on the long-term trend of the channel and it might take a while to unfold its true potential.
For now, expect a small drop towards the channel support after which the price has a high chance to reverse.
Happy trading!

ATM/USDT Update: Fully reached our >100% TargetATM had a good month and reached our target.
Since ATM is out of champions league I guess we go down within the shortterm.
That's why the re-entry box is that far down.
Basic rules:
- Never buy the top/ATH
- Take profit as long as you can
- Use Stop/loss for leveraged positions
- If you are not experienced, don't leverage in the first place
Enjoy the ride and don't be too greedy.
If you like the content, please like, comment and give this channel a follow.
Always do your own research and keep in mind that my charts and comments cannot be considered financial advice.
Cheers
ps.
Chart explanation:
Main lines:
- Green lines are tested support lines.
- Orange lines are resistance lines or, if we are above, possible support lines which were not tested yet.
- Cyan line is for volume trendline.
Helplines:
- Purple lines are trendlines we take a look at.
- Yellow lines are for visual help only.
Boxes:
- Either entry zone or support zone. Check the description.


ATM targets and analysesthis currency just finished the accumulation
also trend is breaking and we had a nice RD divergence
RSI is breaking 50 level
all this factors are bullish
i expect rally to T1 and T2 for this currency


🔥 ATM Picking Up After ConsolidationATM is showing some strong bullish behaviour over the last couple of hours, obviously helped by the strong gains of Bitcoin earlier this morning.
This trade is based on the idea that ATM will finally break-out of the horizontal channel in which it has been trading for almost three weeks.
Before entering this trade wait for the price to close above the Entry line. Higher time frames yield a higher predictive power.
On the chart I’ve marked two potential areas of resistance, R1 and R2. These areas are based on recent swing highs and round numbers. Do your own due diligence.
Happy trading!

ATMUSDT 4H Long setup; Bounce from support zoneTA Explained
ATM bounced from support zone after a pullback of the impulsive move of the first half of February. Now found support and created a series of higher lows. Ready to move upward.
Trade setup
Best entries: 6.801 - 7.214
TP1: 8.154
TP2: 9.616
TP3: 11.584
SL: 5.5797
RR: 3.81
Max leverage: 1x
—————
Do Your Own Research (of course)
Trade at own risk (of course)
Only trade what you can afford to lose (of course)


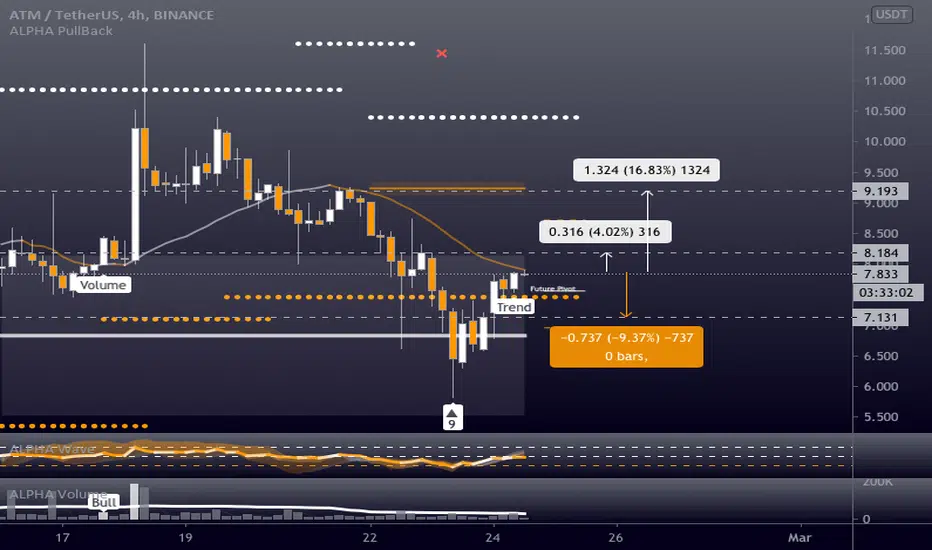
ATMUSDT - Long - Potential 16.83%ATMUSDT - Long - Potential 16.83%
Entry- 7.882
TP1- 8.184
TP2- 9.193
SL- 7.131
- Trigger - Trend / TD9
- BTC - Dominance & Price Falling - Alts Recovering
- RR - 1.5
- Trailing Buy - 1%
- Trailing Profit - 1%
- Trailing Stop-Loss - no