ATOMBTC - 4h sell signal💡💡#SIGNAL 💡💡
ATOM / BTC
▶️ SELL NOW + Block
🔴 SLT - 4h (Trigger)
The transaction is risky, because 1D is ascending. But at 4h, a downward reversal begins. Because of the risks, I enter into this transaction 1/2 of the standard amount.
#ATOMBTC_4h_060322
ATOMBTC trade ideas

$ATOM/BTC 3D (Binance Spot) Symmetrical triangle break & retestCosmos Network has pulled back to 100EMA support, seems ready to bounce and resume bullish here!
Current Price= 0.0004900
Buy Entry= 0.0004904 - 0.0004394
Take Profit= 0.0006795 | 0.0009367 | 0.0014620
Stop Loss= 0.0003574
Risk/Reward= 1:2 | 1:4.39 | 1:9.28
Expected Profit= +46.16% | +101.48% | +214.48%
Possible Loss= -23.12%
Fib. Retracement= 0.5 | 0.883 | 1.414
Margin Leverage= 1x
Estimated Gain-time= 7 months
Website: cosmos.network
Contracts:
#Mainnet

ATOM BTCNice move out of ATOM today - shown here is the pair ATOM/bTC - I think that we start to move higher to the high end of the purple box - one to watch if it does...

ATOMBTCGeneral Guide:
1.) Anything above price is a resistance, anything below is support.
2.) Proceed with caution when taking a trade based off of this chart.
3.) Make a copy of it to watch it in real-time. Click the share button, then "Make it Mine"
4.) It is very risky to set limit orders, I advise you to set alarms and when it hits, check how it reacts.
5.) Watch the BTC pair closely as price will generally follow that pair.
6.) Definition of Terms:
Bearish/Bullish Order Block (OB) - Price rejects or bounces respectively.
(Monthly/Weekly/Daily) Liquidity - Where retail stop loss orders are.
pm/pw/pd/pr - Previous Month/Week/Daily/Range
VAH/VAL/POC - Value Area High/Low and Point of Control (70% of traded volume in a range)
OTE - Optimal Trade Entry
Rectangles - Liquidity Pools
Diagonals - Probably a Fib Resistance Fan, Pitchfork or Pitch fan
nPOC - Naked Point of Control
Eq - Price Equilibrium
Single Prints - Liquidity Voids

ATOMBTCHello Crypto Lovers,
Mars Signals team wishes you high profits.
We are in the 4-hour time frame. The price has had a bearish trend and the S1 has been a support line. There are two resistance lines R1 and R2 on the way of the price up. It is possible for the price to move down close to the S1 line and then go up. Or it is also likely for the price to go up straight from here. You can divide your money and buy half of it here and the other half at the S1 line. Also remember to put in the Stop Loss. If R1 is broken, R2 would be the next target.
Warning: This is just a suggestion and we do not guarantee profits. We advise you to analyze the chart before opening any positions.
Wish you luck

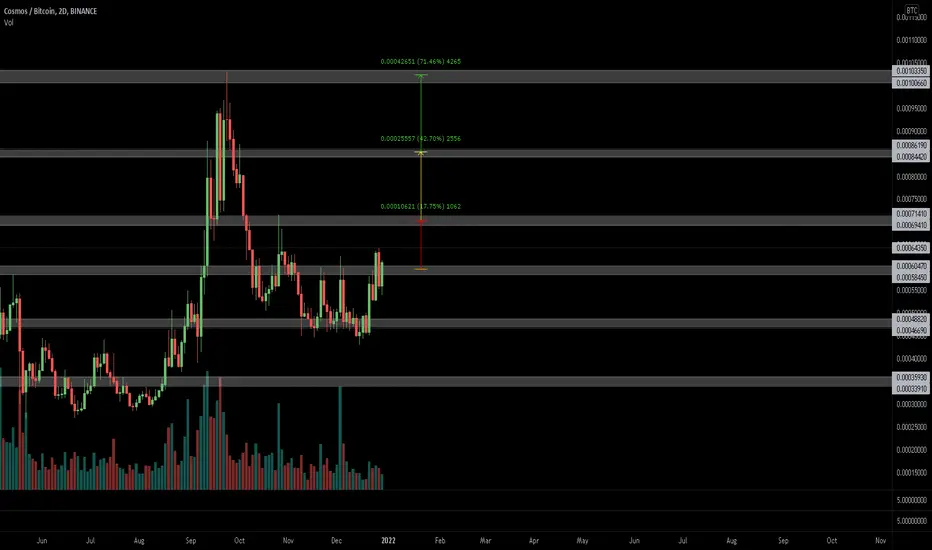
Which direction will ATOM / BTC chooseAs you can see, ATOM moves in the drawn channel with blue lines. Currently, the price is based on support, while the next levy is plotted at 0.0006722btc. We are halfway through the current channel, it is worth waiting which direction ATOM will take.

ATOMBTC - Long - Potential 21.45%ATOMBTC - Long - Potential 21.45%
Exchanges: Huobi.pro, Binance, Bittrex, KuCoin
Signal Type: Regular (Long)
Entry Targets:
1) 0.00087076
Take-Profit Targets:
1) 0.0009115
2) 0.0009958
3) 0.0010589
Stop Targets:
1) 0.0007968
Entry Triggers - Bottom of a nice bullish triangle on 200EMA support.


$ATOM, on a HH/HL sequence on the daily..$ATOM
on a HH/HL sequence on the daily..
10% up since entry on the latest UCTS 2D Buy signal
Looking for a true breakout above 64k sats 🤞
#ATOM
Atom/BTC: cup and handle hat-trick?Atom entered its 1st of 3 cup and handle patterns in January 2021. Another one began in July 2021. Both breakouts led to 166% gains. We are currently in the handle of the 3rd cup and handle pattern.
I thought it was worth noting...

ATOM/BTC 1HOUR UPDATEWelcome to this quick REENTRY ATOM / BTC analysis.
I have tried my best to bring the best possible outcome in this chart.
Reason of trade:- ATOM/BTC Triangle pattern create and retest and the buy the dip and retest green zone
Entry:- reentry buy green zone
Traget:- 20% to 25%
Stop loss:- 0.0008770
Remember:-This is not a piece of financial advice. All investment made by me is under my own risk and I am held responsible for my own profit and losses. So, do your own research before investing in this trade.
Happy trading.
Sorry for my English it is not my native language
Do hit the like button if you like it and share your charts in the comments section.
Thank you.

ATOM/BTC 30M UPDATEWelcome to this quick ATOM /BTC analysis.
I have tried my best to bring the best possible outcome in this chart.
Reason of trade:- ATOM/ BTC Triangle pattern create to buy the dip and retest green zone
Entry:- buy green zone
Traget:- 20% to 25%
Stop loss:- 0.0008377
Remember:-This is not a piece of financial advice. All investment made by me is under my own risk and I am held responsible for my own profit and losses. So, do your own research before investing in this trade.
Happy trading.
Sorry for my English it is not my native language
Do hit the like button if you like it and share your charts in the comments section.
Thank you.

ATOM/BTC measured move.This is looking good for continuation. We have good structure with higher lows.
Target at 14470.

ATOM topping out?In stark contrast with the rest of the market, Cosmos was able to make a nice run up during the past couple of weeks. Especially if we hold it up against its Bitcoin pairing.
It has currently twice rejected its ATH resistance zone and is playing with RSI overbought levels. EMA's are still curling away from each other so a continuation is also still in the cards. Although I strongly believe Bitcoin will regain some strength here which can offer a nice shorting opportunity for this pair.
What do you think?

Cosmos ATOMBTC - Bullish head and shoulders- ATOM is one of the great looking coins on the crypto market right now.
- On the weekly chart we can spot a head and shoulders - reversal bullish pattern.
- Also ATOM vs USDT looks very nice for upcoming uptrend.

ATOMBTC - INVEST IDEA💡💡#INVEST 💡💡
ATOM / BTC
▶️ Buy in 1Block (40%) + 2Block (40%) 0.0003902 - 0.0004347) + (0.0002560 - 0.0003250)
This is an investment idea. There are no stops here. I leave 20% in case of force majeure. As practice shows, the profitability of investments is higher than in trade. Duration: 1 - 12 months.
#ATOMBTC_INVEST_111221


ATOM BTCUpdate on Atom zooming in ;
on btc pair there are 4 levels where most People are looking to. the 3 fibs and the green box.
Just wait for a conformation on the levels or the box to enter the trade.
Target 60% on btc.

ATOM BTC COSMOSCHALLENGE:
Post a better chart.
I am interested by the green lines and I have to see how the price develops on these lines on shorter timeframes.
The green box would be a real and Christmas present.
Red box flipping is for me the first signal for bull momentum to resume. Red line flipping and I'm going really big long on this one.

holy shit/ cooling down first if in need but full gas is okI bought a shitload of atom before the crash and kepts dca into it afterward


A-B-C-D-E Correction CompletedBreakout of the descending wedge after C and then a re-test at E. Bounce showing off lower teal line at E and Bollinger Bands are contracting, which usually means volatility is imminent (as you can determine by looking at the chart when bollinger bands contract. RSI is on the rise and support has been retested. Strong probability of bullish movement.
Not financial advice and trade safe!

