Cosmos Atom Triple Bottom PatternTriple Bottom Pattern on Cosmos Atom token. If BTC doesn't stays above $46,000 we should see a rally back towards the lower $30s, which is where Cosmos likes to settle on the high side.
Current low price of Atom, $22.59 is right at the 200 day moving average.
If you want to learn more about Cosmos, I recommend a bunch of videos done by @cryptocito and @coneydaddy. And then check out Cosmos' map of zones to see all the projects in the ecosystem, don't forget to hit the testnet switch to display all the cosmos projects in development, it is truly mind-blowing.
Not investment advice and I don't know what I'm doing, but thought it'd be nice to share a little creative moment about a project I've been following.
ATOMUSD trade ideas

confirmation of down trendThe downtrend of the atom is continuing, and the confirmation of the downtrend can be seen in the breaking down of the range area and intersection of the moving averages.

Whats coming for ATOMATOM’s price, after holding well for a couple of days, recorded a swift fall. But, with gains coming in at the time of writing, ATOM’s recovery could be swifter. Interestingly, pseudonym analyst Bluntz notes a similarity between ATOM and AVAX’s price structures, anticipating that ATOM could rally north. According to the analyst, the crypto presented a similar trajectory that AVAX had during the beginning of this year.
Well, while ATOM’s prospects of picking up pace look good, its price needs a retail push above the $30-mark. ATOM’s trade volumes still don’t suggest retail euphoria and a return of retail interest could reignite the alt’s rally.

Short term thoughts on ATOMATOM is gearing itself for a possible bullish rally in the days to come. If this happens, the crypto might go beyond its resistance level and reach the bullish price. Of course, this is most likely to happen if the bullish market continues to reside with ATOM

ATOM price perdiction P3The only thing we can do now is to wait till mid/end December. A 2x is likely for ATOM in the short term. But, when the bear market hits I think it will be around 15$ maybe even lower.

COSMOS could be heading higherNot investment advice. Please do your DD
ATOM looks to have completed ABC correction. Looking to move higher.

ATOM price perdictionMedia go brrr is likely bcz of BTC pumping in December, most people say altcoin season would be over by then but I don't think so.

ATOM price perdiction P2As we saw, A lot of people are looking at ATOM. ATOM was one of the biggest gainers on 3 Dec 2021 but came back fast. With Atom pumping it got some media attention but not too much. Once the altcoin season in December goes parabolic ATOM will go to around 50$ at the end of 2021. ATOM has a lot of support at 25$ and massive resistance at 33$. I think some 2x/3x in a month are possible. Target around 45 - 60.

36-38 againWas expecting a rise to 32, and now 38. I do want for sure a break upside 32 to consider 38, obviously. And also since I do expect some more testing that could happen around 31.2, and even back to 29.2, before it moves upward furthermore.
And I do expect a rise to 44 as well on a longer term, but these were my first target zones.
If there would be a break under 29.2, then it would mean 25-26, but for now buying interest has been consistent enough to not go play within that zone.
Weekly
Monthly
Update will be provided as this move through the cycle.

ATOM Swing TradeLooking at a good opportunity if we can hit the golden pocket on the fib retracement, although I'm not sure we will with the support range.
On the FA side, I anticipate a leg up similar to LUNA as these assets were grossly underpriced.
On the TA side, we have been able to reverse market structure, and break through a previous resistance, along with a weak double bottom. Further, our TP of 42 at the 0.618 line is reasonable as it is below our next resistance level.
(Another trade I might explore is another FIB extension once we hit 0.618 with a new setup to see if we cant get acrross that higher range).

#ATOM Looming Breakout#Atom looks set to test the stiff resistance at $32, which was previously serving as support.
- It will be hard, as the line coincides with the 100 & 50 day MAs.
- A breakout and close above it will lead to retest and continuation up to the all time highs as shown at the chart
- If not successful, the price will return to the lower supprt around $23 and continue ranging. Good for stacking in such case.
Overall- Bullish

ATOM LongPA near lower resistance, money will rotate from L1s. LUNA pumping is a sign for ATOM following shortly after. Proposal 56 was passed back in September but now more people are looking at it and what it means for Cosmos to be the IBC hub. Also @blknoiz06 hinted at a cosmos trend.

ATOM long setupPrice rejecting major S/R level on the daily and broke out of the descending triangle pattern and rejecting the 1H50EMA + .5 and .382 fib retracement.
Invalidation below the .786 (White line)
Targeting the D20 at least and letting the rest moon


ATOMLooks like ATOM has bottomed and the bulls have filled all their bags, I think we going back up from here

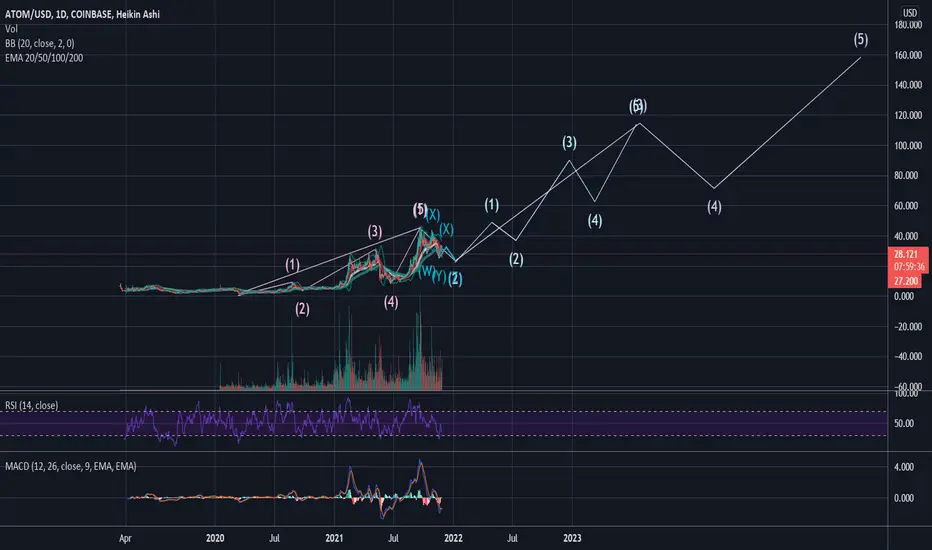
atom/usdTesting/tracking elliot wave theory. Please do not trade off idea without S/L. Not financial advice.
ATOMUSDT : There is a potential H&S pattern but...In ATOMUSDT 1H
There is a potential H&S pattern but there is still a downtrend need to break out.
If the price break out the downtrend and stand firm,trading strategy as below.
SL :29.163
TP1: 36.110
TP2: 37.044
TP3: 38.047
TP4: 42.295
If you like this analysis, give it a like or share your thought or let me know what crypto TA you want to know.

ATOMUSD Gann AnalysisAnother idea for ATOMUSD supporting my bearish stance
Initially price can be seen to hit the 1/2 Gann line, slowly though with each peak, price weakens, moving further and further away from this line
While being inside a rising wedge, a bearish view is justified
The indicator shows similar points (yellow) and expected downward move to follow
Heres my previous analysis on ATOMUSD which is also a bearish one


Atom first target:18 $Hi
Atom breakdowns Range area and the support level
Based on Renko extension, the first target can be 18 $

ATOM - Something is missing hereNot financial advice. I have been keeping my eye on L1 Smart Contract/Defi Cryptos and most of them are astronomically high besides a few. ATOM and AVAX seemed to be moving together with ATOM leading and all of that momentum seemed to get transferred to AVAX which gets me thinking we could see it come back into ATOM soon especially with news and updates creeping in. My possible top for ATOM is $110 at the 4.236 Fib extension. If you are looking for more upside and less risk potential I would be in ATOM over AVAX. Doesn't mean that AVAX can't go up more in the short term all I'm saying their is possibly more upside within the next month percentage wise.

ATOM cosmoc trendNo financial advice yesterday i noticed that atom is recovering really good so i started looking in to it and this is my conclusion

ATOMUSD - Correction into sell zone 37.00Price soaring upward into 37.00 cluster zone. Expected rejection from the zone continue down.
