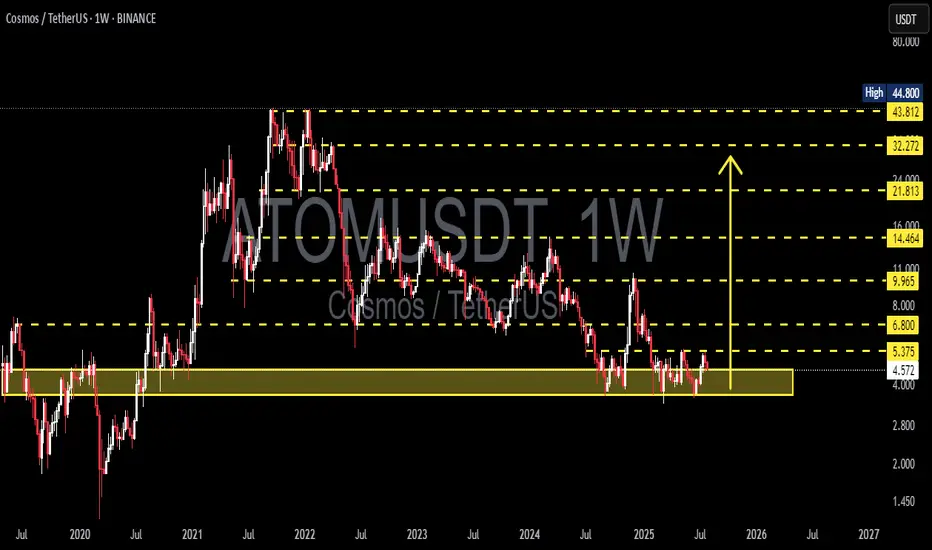
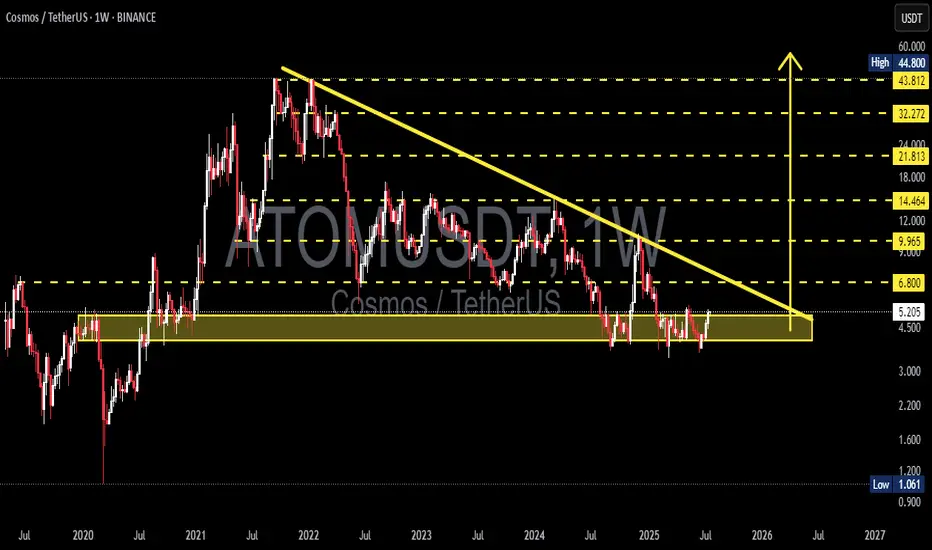
Cosmos 365 · Proof of Bullish · Bull Market Wave NextCosmos (ATOMUSDT) has been sideways for an entire year now. The current trading range is a long-term support, buy and accumulation zone. This zone is already proven to be a bullish launchpad based on late 2024. The same levels were active in August-October-November 2024 leading to a mild bullish wav
Related pairs

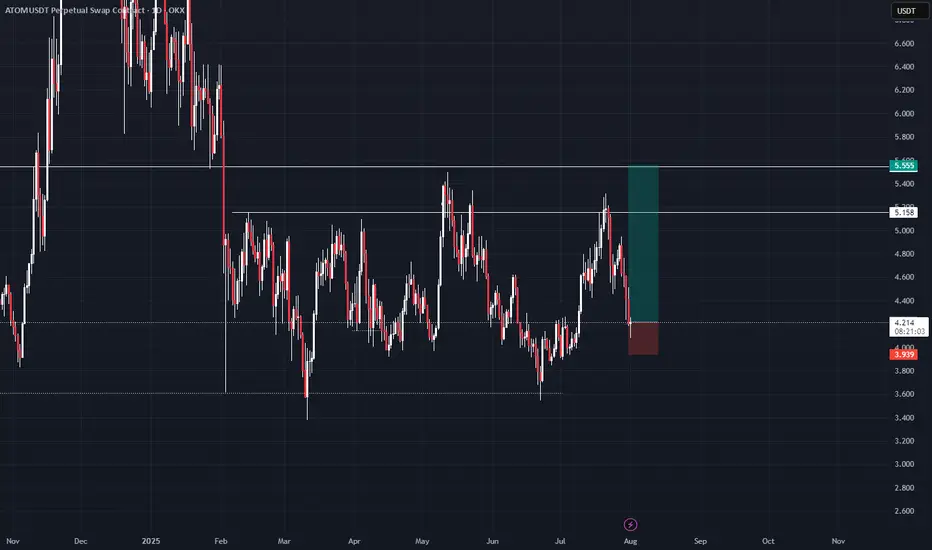
ATOMim thinking about that as a diviation from global diapozone so we have to at least test its lower boarder 5.555 that is my first target if we will return higher than 5.555 ill be looking for 11.4 as a swing target
ATOM/USDT Weekly Analysis – Major Reversal Incoming?🔍 Technical Structure & Price Action:
ATOM has been in a prolonged downtrend since peaking at $44.80 in 2022, forming consistent lower highs and lower lows. However, the price has recently returned to a major long-term demand zone between $4.00 – $5.37, which has historically acted as a strong supp
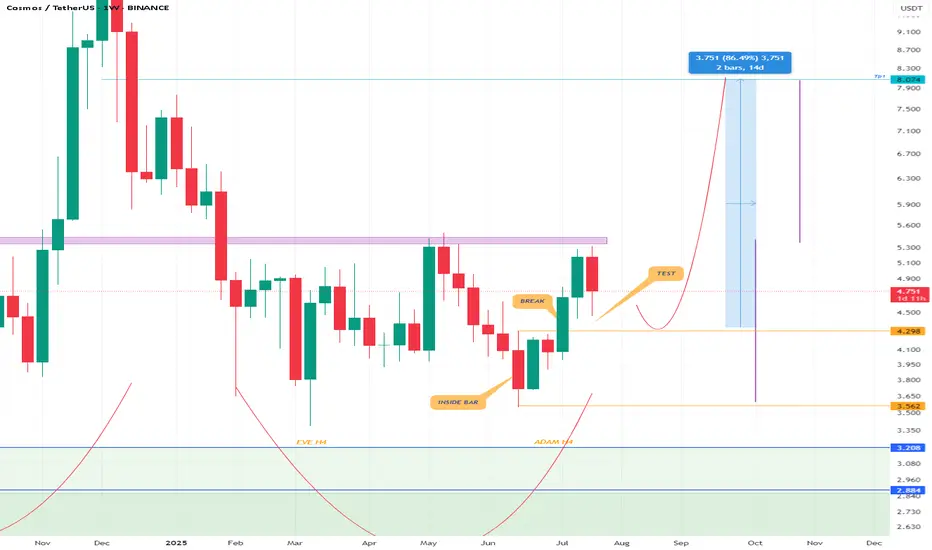
ATOMUSDTAtom has broken out of a good inside bar pattern and is testing it. I think most altcoins have this pattern on the weekly timeframe (you have to check the charts yourself and see what the charts tell you, not what people are emotionally saying on social media). I think the chart can move towards hig
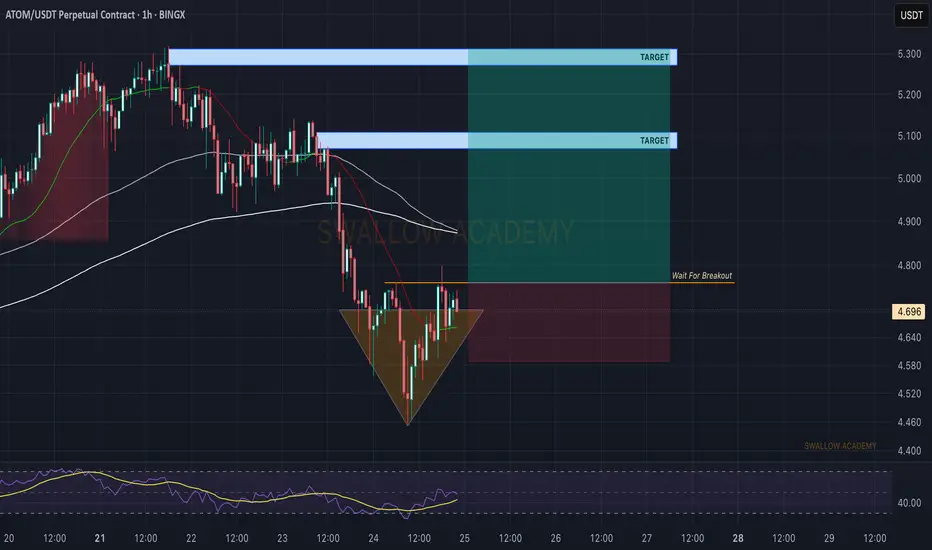
Cosmos (ATOM): Reached Major Support Area | Good Buying Moment?Cosmos has really good potential for good risk:reward if we see proper MSB to form so that's what we will be waiting for.
More in-depth info is in the video—enjoy!
Swallow Academy

Cosmos (ATOM): Waiting Is Key | Potential Breakout IncomingCosmos might have a good buying opportunity soon, where we are looking for a proper MSB, which would confirm our bullish scenario for this setup here.
As soon as we get the MSB, we are going to look for a buying opportunity.
Swallow Academy
Cosmos (Atom)Atom usdt Daily analysis
Time frame daily
We have 2 models of analysis
1. The green line. Price can't break the resistance line and fall down to 3.5$
2. Price can break the resistance (gray line) and pump to 9$
Therfore we must watch the reaction of price and resistance

ATOM/USDT – Long-Term Accumulation Phase Nearing Breakout?📊 Full Technical Breakdown:
🟡 Long-Term Accumulation Zone
ATOM is currently trading within a horizontal accumulation zone between $4.50 and $5.20, which has held strong since early 2021. This key area has acted as a solid floor across multiple market cycles, suggesting strong buying interest from
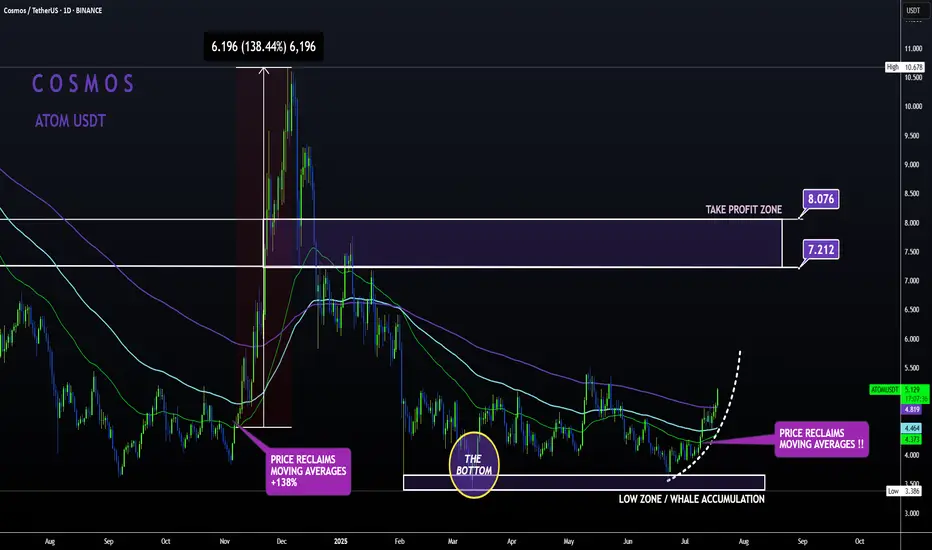
ATOM Sleeping GIANT ALT | Moving Averages BULLISH like NOV24'ATOM is slowly but surely making a turn up towards the first Take Profit point.
From the bottom, Cosmos has already increased a whopping 52% , with even more room to grow:
In my previous update, the 4 was still bearish when looking at trend lines and moving averages.
However, this has flipped
ATOMUSDTHello, the Atom currency has several reversal patterns in its price floor and accumulation. On the daily time frame, we can see an ADAM and EVE. If we look from a more distant perspective, a twin bottom has also formed in the weekly time frame as an extension that seems to be able to grow well. If y

See all ideas
Summarizing what the indicators are suggesting.
Oscillators
Neutral
SellBuy
Strong sellStrong buy
Strong sellSellNeutralBuyStrong buy
Oscillators
Neutral
SellBuy
Strong sellStrong buy
Strong sellSellNeutralBuyStrong buy
Summary
Neutral
SellBuy
Strong sellStrong buy
Strong sellSellNeutralBuyStrong buy
Summary
Neutral
SellBuy
Strong sellStrong buy
Strong sellSellNeutralBuyStrong buy
Summary
Neutral
SellBuy
Strong sellStrong buy
Strong sellSellNeutralBuyStrong buy
Moving Averages
Neutral
SellBuy
Strong sellStrong buy
Strong sellSellNeutralBuyStrong buy
Moving Averages
Neutral
SellBuy
Strong sellStrong buy
Strong sellSellNeutralBuyStrong buy
Displays a symbol's price movements over previous years to identify recurring trends.
Frequently Asked Questions
The current price of COSMOS/TETHERUS (ATOM) is 4.273 USDT — it has risen 0.05% in the past 24 hours. Try placing this info into the context by checking out what coins are also gaining and losing at the moment and seeing ATOM price chart.
COSMOS/TETHERUS price has fallen by −11.01% over the last week, its month performance shows a 7.26% increase, and as for the last year, COSMOS/TETHERUS has decreased by −12.64%. See more dynamics on ATOM price chart.
Keep track of coins' changes with our Crypto Coins Heatmap.
Keep track of coins' changes with our Crypto Coins Heatmap.
COSMOS/TETHERUS (ATOM) reached its highest price on Dec 4, 2024 — it amounted to 10.678 USDT. Find more insights on the ATOM price chart.
See the list of crypto gainers and choose what best fits your strategy.
See the list of crypto gainers and choose what best fits your strategy.
COSMOS/TETHERUS (ATOM) reached the lowest price of 3.386 USDT on Mar 11, 2025. View more COSMOS/TETHERUS dynamics on the price chart.
See the list of crypto losers to find unexpected opportunities.
See the list of crypto losers to find unexpected opportunities.
The safest choice when buying ATOM is to go to a well-known crypto exchange. Some of the popular names are Binance, Coinbase, Kraken. But you'll have to find a reliable broker and create an account first. You can trade ATOM right from TradingView charts — just choose a broker and connect to your account.
Crypto markets are famous for their volatility, so one should study all the available stats before adding crypto assets to their portfolio. Very often it's technical analysis that comes in handy. We prepared technical ratings for COSMOS/TETHERUS (ATOM): today its technical analysis shows the sell signal, and according to the 1 week rating ATOM shows the sell signal. And you'd better dig deeper and study 1 month rating too — it's buy. Find inspiration in COSMOS/TETHERUS trading ideas and keep track of what's moving crypto markets with our crypto news feed.
COSMOS/TETHERUS (ATOM) is just as reliable as any other crypto asset — this corner of the world market is highly volatile. Today, for instance, COSMOS/TETHERUS is estimated as 3.78% volatile. The only thing it means is that you must prepare and examine all available information before making a decision. And if you're not sure about COSMOS/TETHERUS, you can find more inspiration in our curated watchlists.
You can discuss COSMOS/TETHERUS (ATOM) with other users in our public chats, Minds or in the comments to Ideas.