ATOM: Understanding the Key Levels and Trends✨ Welcome to my channel. Here, we analyze a new crypto project or Forex pair every day.
📅 Let's dive into today's analysis, focusing on the ATOM coin in the crypto market.
🗂 About the Project: ATOM, or Cosmos, is a decentralized network aiming to facilitate interoperability between multiple blockchains. It is known for its unique consensus mechanism and ability to enable communication between different blockchain networks. Cosmos is particularly popular among DeFi and blockchain developers due to its scalability and modular architecture.
📅Weekly Timeframe
In this timeframe, ATOM has experienced significant movements. Recently, it saw an upward trend reaching a peak around the $44 level, which was a critical supply zone. Following this, the price entered a correction phase with lower volume, suggesting the strength of the previous upward trend. Currently, ATOM is at a support level of $6.51 after a correction phase.
📈 If ATOM stabilizes above $8.08, we can anticipate a bullish momentum potentially pushing the price towards the next resistance at $16.07. Confirmation of a new upward trend will depend on candle stability above this level.
📉 Conversely, if ATOM falls back into the range between $6.51 and $8.08, and stabilizes below $6.51, it indicates a bearish trend continuation. The next critical support level would be around $4.50.
📊 In both scenarios, volume analysis is crucial. A healthy trend should be supported by corresponding volume without any divergence.
📅Daily Timeframe
🔍 On the daily chart, ATOM ranged around the $8.07 level before initiating another downward wave. Currently, there is noticeable bearish momentum, and the price has found temporary support at $6.00.
🧲 Given the current setup, a stabilization below $6.00 could signal another bearish wave. On the flip side, if the price moves above $8.07, it could indicate the start of a bullish trend, targeting higher resistance levels.
📅4-Hour Timeframe
📈 In the 4-hour timeframe, ATOM has pulled back to the resistance at $6.56. Volume analysis shows a decrease, indicating potential exhaustion of the recent upward movement.
📉 For short positions, the key levels to watch are $6.56 and $7.03, where price reactions could provide better entry points. For long positions, critical levels are $5.77 and $5.20.
💥RSI Oscillator
The RSI is currently ranging between 31.20 and 36.56 on different timeframes. Breaking these levels could provide confirmation for opening positions. However, always use these levels in conjunction with candle patterns and volume analysis to find the best entry and exit points.
📉 Given the current bearish signals in the daily and 4-hour timeframes, alongside the potential trend change in the weekly timeframe, I am inclined to open a short position. However, this is based on my trading strategy. Each trader should base their decisions on their strategies and risk management plans.
⚠️ Please note that this is not financial advice. I'm simply introducing this project to you, and remember always to do your own research.
🫶 If you found this analysis helpful and want to support me, please boost this analysis. Feel free to leave a comment or suggest a coin you'd like me to analyze next.
ATOMUSDT trade ideas


ATOM (COSMOS) SHOULD JOIN THE ALT SEASON FROM HERE
BINANCE:ATOMUSDT should be doing this if it really have intention of joining the bull run. It is quite close to the invalidation level but the risk reward is insane almost 90.
More update to come stay tuned. BINANCE:PEPEUSDT is at the level i called so is many alts. We saw this coming billions have been liquidated.
OTHER ANALYSIS


Future forecast with fractal pattern detectionTake this as a representation of entire market structure
On the first pannel, you can see 4 boxes
The bigger ones A+B (green continuous period) are a perfect representation of the smaller ones A+B (green dotted period)
They are fractaly similar
So, we will take the small pattern period to reveal what will happen with the bigger period
And that is what we see on the 2nd pannel: the blue line on the 2nd chart is the exact pattern of the small period, but plotted over its bigger counterpart
Hold tight, because it will be a great ride!


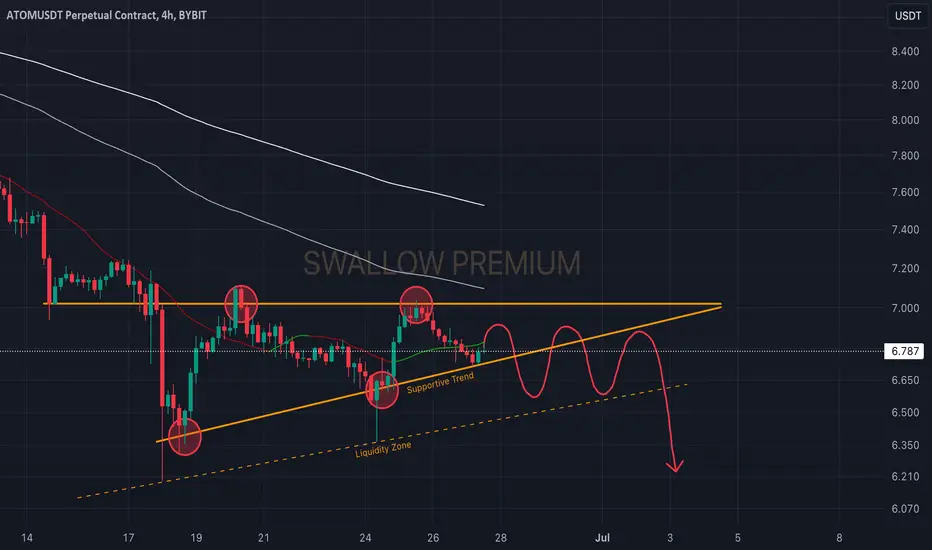
Cosmos (ATOM): Looking For Break of Trend!Looking at Cosmos in smaller timeframe, we are looking at a smaller triangle formation where price is now testing that lower support zone, which may bounce or break this zone there.
We are looking for a repeat of history where each time the price touched that support, it also went to the liquidity zone as well.
So the game plan is simple here Now we wait for break of trend 😉
Swallow Team
What does Cosmos Hub ATOM price prepare for us ?We would diagnose #Cosmos Hub that the patient is more dead than alive.
Or maybe you can convince us otherwise?)
Therefore, this idea is more for those who have been holding NASDAQ:ATOM for a long time and are waiting for a miracle from it)
Because we would not buy this coin with our own money now.
🔽If you have been holding #ATOM for a long time, you need to be psychologically prepared for the fact that the price may drop to $4.
🔼And you can also hope that MM will repeat with the #ATOMUSDT pair what it does every summer/autumn - it organizes without corrected growth
If the #ATOMUSD price consolidates above $8, it will be a good sign.
After that, you can start dreaming of a hike to $13.5, and if you're very lucky, to $19-21.5 🔝
_____________________
Did you like our analysis? Leave a comment, like, and follow to get more

ATOMUSDT is approaching the main downtrend Hey Traders, in today's trading session we are monitoring ATOMUSDT for a selling opportunity around 7.8 zone, ATOMUSDT is trading in a downtrend and currently is in a correction phase in which it is approaching the trend at 7.8 support and resistance area.
Trade safe, Joe.

COSMOS Update in Daily Timeframe#ATOMUSDT Update:
ATOM has been in a downtrend for a while and has finally reached the long-term support level ranging between $6.4 and $6.7.
Currently, the price is bouncing back, and it needs to break above the resistance trendline at $7.6 to confirm a rally toward the second resistance at $8.9 (a 32% rally).
The invalidation point for ATOM will be a candle close below the $6.2 support level.
DYOR, NFA.

Cryptocurrency ATOM Near Its Fundamental ValueThe cryptocurrency Atom is quite close to its fundamental value. If you're following this coin, rest assured that buying it in the range of $4-$6 will be a gift.
I don't know exactly when Atom will drop to its fundamental value zone, but when it does, be ready. The current price is already quite attractive, so my advice is to buy in parts. This way, you won't miss the rise and will have the opportunity to buy more if the price drops to the fundamental value zone.
Leave the name of your coin in the comments if you want me to analyze it next time and show the best buying points.
All I ask is a like and a follow.

ATOM COIN CAN GO 8$ EASILY FROM HEREATOM looks eye catching from here on 1H time frame. Took major demand liquidity and shifted its trend into bullish now by breaking previous high, As MSS has been done so we will look for fvg and sell side liquidity with order block to long it. Two pois are mentioned onto the chart.

Cosmos | ATOMAfter taking profit at 15$ its correction time and here we are, but whats next?
The price of ATOM is $11 today with a 24hour trading volume of 120 million dollar. This represents a -1% price decline in the last 24 hours and a -15% price decline in the past 7 days
Cosmos bills itself as a project that solves some of the “hardest problems” facing the blockchain industry. It aims to offer an antidote to “slow, expensive, unscalable and environmentally harmful” proof-of-work protocols, like those used by Bitcoin, by offering an ecosystem of connected blockchains.
The project’s other goals include making blockchain technology less complex and difficult for developers thanks to a modular framework that demystifies decentralized apps. Last but not least, an Interblockchain Communication protocol makes it easier for blockchain networks to communicate with each other — preventing fragmentation in the industry.
Cosmos’ origins can be dated back to 2014, when Tendermint, a core contributor to the network, was founded. In 2016, a white paper for Cosmos was published — and a token sale was held the following year. ATOM tokens are earned through a hybrid proof-of-stake algorithm, and they help to keep the Cosmos Hub, the project’s flagship blockchain, secure. This cryptocurrency also has a role in the network’s governance.
I will start average buying at 9$ and I will close my shorts at 9.3$


Maintaining the support rangeThe range between $6.715 and $6.350 is critical. This area acts as a strong support zone, and maintaining it could be the foundation for a strong upward movement.
If the price manages to hold the support range, we expect it to reach the level of $7.117. This level can act as a price target, which could be achieved with increased demand and sustained support.


Cosmos (ATOM) will die or reach the sun? Ultimate overviewHello, Skyrexians!
While Bitcoin is staying inside the price range, altcoins are collapsing every day. BINANCE:ATOMUSDT is not an exception. It has tested the bottom at $6 once more. For sure, it's not pumping because top crypto traders continue talking about altseason. Most of people simply copy trade and therefore, the crowd is sitting is assets and waiting for the growth. Most of investing and crypto trading strategies and trading bot strategies giving the strong long signals, but even if you use the great cryptocurrency trading strategy, it's necessary to take into account the sentiment. It's very difficult to pump assets if everybody bought it and wait for the fortune.
In today's article we will try to make it clear if ATOM found it's bottom, what is the current market phase and which possible scenarios can take place in the future. We will define the critical points when it's vital to make a decision. This overview will be useful for investors, traders and for who uses automated trading bots, automated trading software for cryptocurrency or grid trading bot. The potential scenarios can help you to make a decision how to set up your strategy to reduce risk and increase potential profit. Let's get started!
Cosmos global overview
ATOM is pretty old cryptocurrency which has been listed on the major exchanges in 2019. Therefore it has already showed us it's behavior is the bull run 2020-2021 and during the following bear market in 2022-2023. The key feature which we have to define for every crypto asset if it's up trending or so-called "scam" coin. ATOM set the higher low for the current bear market in comparison to previous one. It means the we can expect new ATH in the next bull cycle. Critical point which invalidate this statement located below $2.
Until price is above we will consider previous bull run as wave 1, current bear market as wave 2. It means that next bull run can reach the very high prices in wave 3. The minimal target is $49 which is 1 Fibonacci extension level. The most likely target is 1.61 Fibonacci at $77, and the positive one is above $120, but I personally don't believe in this.
Is bear market finished for ATOM?
Now it's time to look inside the wave 2, is it finished or not. For this purpose we will use the 1W chart and combination of indicators: Alligator and Awesome oscillator.


Cosmos (ATOM): Might Bounce From Local Trend!Comos caught our attention, where price is looking for another support at the local trend line, where previously we have been having nice bullish moves.
We will be monitoring that trend there and if we see that bulls will secure that zone, we will look for a potential bullish movement breaking EMAs; if not, then we will look for a re-test of lower liquid zones!
Swallow Team
