ATOMUSDT trade ideas

ATOM USDT PERP Hello Trader BINANCE:ATOMUSDT.P
in the area of the 1-hour support point
it can be scalped for short-term
short term because the fear is sustained bearish
Please add a comment and Positive feedback and
constructive criticism are important to authors and the
community.
Disclamer: Not Financial Advice

2 scenarios on price action of ATOM/USDT2 scenarios depending on weather price ascends past or is rejected from $8.826/USDT. Price to the upside looking most likely given BTC's action as of late.

#ATOMUSDT#LQR #TOBTC #LaqiraProtocolSupport and resistance are obtained from the confluence of static levels and fibulations. After confirming and matching with Bitcoin levels, you can open a position this analysis is not a buy or sell offer.

ATOMUSD ❕ fixed under the supportATOM has fixed under 50EMA on the 4H TF.
RSI is moving in the bearish zone.
I expect the decline to continue.

Cosmos shortCosmos broke trough the support level. Asset broke trough the ascending trendline. Bearish movement to support level at 8.28 is possible.

Atom/usdt possible longThe daily level confluences with the golden gap or CC of the .618 and .66 fib levels that will be a very strong support for our entry to targer the above weekly and monthly levels.
I think it will be reclaiming the above daily levels before retracing to our entry.
Setup as follow:
Entry: 8.228
SL: 8.094
TP: 10.894

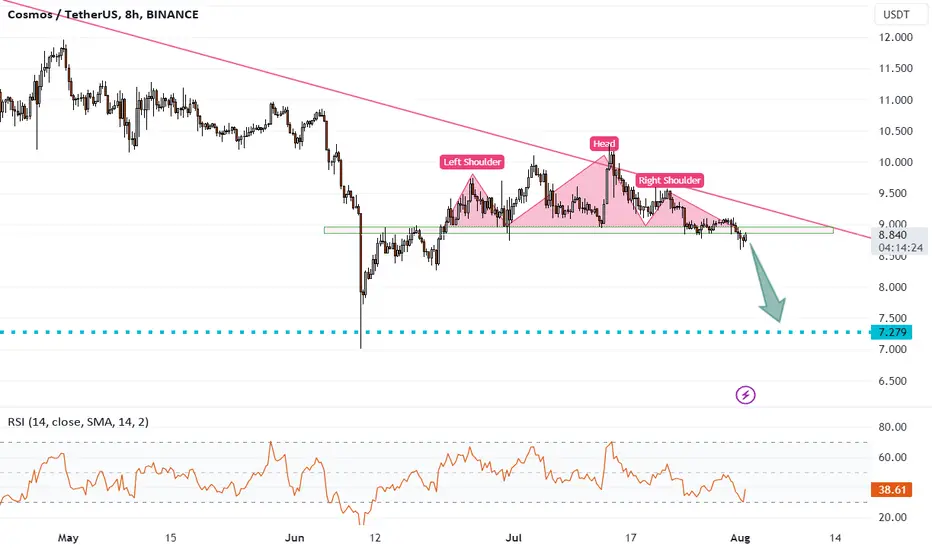
ATOMUSDT growth is not expectedHello everyone! According to ATOMUSDT, the thoughts are as follows: the coin has been in a downtrend for a long time and a trend change is not expected. Therefore, on smaller timeframes, I tried to catch further price movement, of course downwards. At the moment, the coin has drawn something similar to "head and shoulders", although it turned out to be two heads. In any case, there are very good chances after such a pattern to go at least to the past minimum values of 7.2
ATOMUSDT Long/Short (Just an IDEA)Atom will head towards the Immediate resistance are @ 9.2-9.3 area, a strong breakout from the resistance can lead ATOM to hit 10.5-10.6 Area..
This is just an IDEA, Plz DYOR n its NAFA
Thank You

ATOMUSDT is testing the key levelBased on the provided information, the price of ATOMUSDT has recently grabbed new liquidity below the $9 area, and subsequently, it has retraced to retest the weekly support level. This movement suggests that there is a potential accumulation phase happening, with buyers showing interest in the asset at lower price levels.
If the price manages to break above the daily resistance at the $9.3 area, it could signal a bullish breakout according to Plancton's Rules. A bullish breakout occurs when the price surpasses a significant resistance level, indicating a potential shift in market sentiment from bearish to bullish.
According to Plancton's Rules, in this scenario, a new long position is suggested. A long position involves buying the asset with the expectation that its price will rise. By initiating a long position after the breakout, traders aim to take advantage of the potential upward momentum and price appreciation that may follow.
–––––
Follow the Shrimp 🦐
Keep in mind.
🟣 Purple structure -> Monthly structure.
🔴 Red structure -> Weekly structure.
🔵 Blue structure -> Daily structure.
🟡 Yellow structure -> 4h structure.
⚫️ Black structure -> <= 1h structure.
Follow the Shrimp 🦐

Im Back!It has been a while since I last posted, and I'm thrilled to be back! I'm trying to get my old skills back haha.
My First Analysis will be for ATOM/USDT.

ATOM: Waiting for a BUY positionDisclaimer
High Risk Investment
Trading cryptocurrencies and Forex carries a high level of risk, and may not be suitable for all investors. Before deciding to trade cryptocurrency you should carefully consider your investment objectives, level of experience, and risk appetite. The possibility exists that you could sustain a loss of some or all of your initial investment and therefore you should not invest money that you cannot afford to lose. You should be aware of all the risks associated with cryptocurrency and Forex trading, and seek advice from an independent financial advisor. Since Any opinions, news, research, analyses, prices, or other information contained on this website is provided as general market commentary, and does not constitute investment advice. The Bibres will not accept liability for any loss or damage, including without limitation to, any loss of profit, which may arise directly or indirectly from use of or reliance on such information. All opinions expressed are owned by the respective writer and should never be considered as advice in any form.
A qualified professional should be consulted before making any financial decisions.
-------------------------------------------------------------------------------------------------------------------

ATOMUSDT: Falling WedgeATOMUSDT: Falling Wedge
ATOM may exit the falling wedge upwards. This pattern is a bullish pattern that usually leads to higher prices.
Target 1 - 9.1700
Target 2 - 9.2672
Target 3 - 9.3836
Target 4 - 9.5114
If you like the idea, don't forget to subscribe and rate like👍

Range Trend and Growth Signals at $10.6 ResistanceOver the last month, ATOM has been following a range trend, where its price has consistently reacted whenever it reaches the resistance of the downward trend line. This indicates a lack of demand in the $10.294 range. Previously, we identified a potential support zone around $8.648, which the price has not yet reached.
To anticipate potential price movements, we should pay attention to a few factors. Firstly, if the price does touch the support zone and shows a positive reaction along with signs of a trend change and positive divergence on the Relative Strength Index (RSI) in the 4-hour and 1-hour timeframes, there is a likelihood of the price increasing towards the resistance level of $10.6.
However, if the $10.6 resistance is not overcome and the price breaks below it, there could be further declines, potentially reaching the next support zone around $8. This particular support level is situated at the bottom of the second ascending channel, which might prompt a favorable positive reaction.
In the event that the price bounces back from the $8 support zone, we could expect a price growth of at least 30%.
Regarding the RSI level of ATOM at the daily timeframe, it is currently at 42. The Relative Strength Index (RSI) is a technical indicator used to assess the momentum of an asset's price. An RSI level of 42 for ATOM suggests a relatively neutral position, indicating that the cryptocurrency is not oversold or overbought at the moment. However, investors should closely monitor the RSI in conjunction with other technical signals to make more informed decisions about potential price movements.

Brief Analysis ——ATOMToday we will share a brief analysis of 3 old-school tokens. They are ADA, ATOM and ONE.
After rising at the beginning of the 2023, ATOM has fallen since February. And after being defined as a security, it fell through the precious support level (red line). The subsequent rebound never got back above the red line. During the rebound, the bulls was only slightly stronger than the bears. There are very few long green candles and volume was much lower than before. Recently, the price dropped to the green dotted line.
Conclusion: Mostly falling. The rebound of ATOM did not cover the loss caused by FUD, so it remains bearish on a large scale. If the bulls cannot defend the dotted green line, the price will break out and keep falling. We set resistance level at 10.3, which is strong. Although the price has not confirmed that it has fallen below the green dotted line, but considering that the bears are dominant, we set support level at 8.2.
If you have any ideas, welcome to communicate with us:)
Disclaimer: Nothing in the script constitutes investment advice. The script objectively expounded the market situation and should not be construed as an offer to sell or an invitation to buy any cryptocurrencies.
Any decisions made based on the information contained in the script are your sole responsibility. Any investments made or to be made shall be with your independent analyses based on your financial situation and objectives.

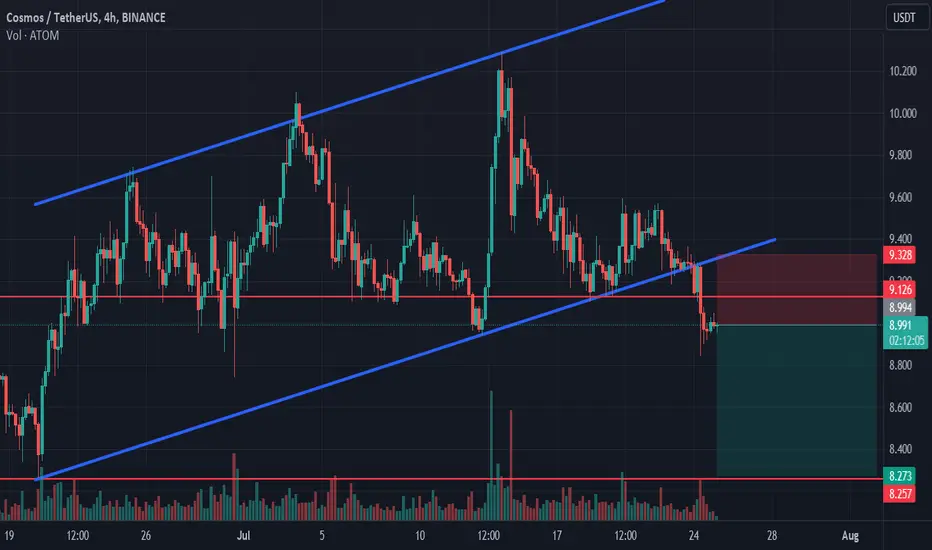
Cosmos shortCosmos broke trough off the lower boundary of ascending channel. Asset broke trough the support level. Bearish movement to support level at 8.27 is expected to happen.

ATOMUSD ❕ broke down the channelRSI is moving in the bearish zone.
The 50EMA broke down through the 200EMA on the 4H TF.
I believe that after the retest and fixing under the resistance level, the chart will continue to decline.

$ATOMreclaim 29600 for bitcoin and this was a fakeout
reclaim blue line is my trigger for a long here
not in a rush but gut saying we go back up

ATOM 4h reviewprice is moving into a descending channel since 5 month ago.
right now it is trying to close above daily 50MA and MACD (daily line) also turned in bullish level.
so closing above the channel is a good sign for stronger rally to come. and closing above daily 200MA will accelerate this process.
I put the baseline on the chart and in any case, moving above this level ( around 8.8$) it is bullish.
also in case of the bull run scenario we can expect the resistant levels on the chart will hit as targets.
Enjoy the market

ATOMUSD bullish continuation ATOMUSD looks like it's ready to continue the uptrend.
After the price hit the upsloping support line it has continued an uptrend.
Take profit: 10,247
target 1: 11.898
target 2: 12,920
target 3: 14,638
We expect a green summer for altcoins and ATOM is on our buy list now.

ATOM LOOKS BULLISH (4H)Hi, dear traders. how are you ? Today we have a viewpoint to BUY/LONG the ATOM symbol.
For risk management, please don't forget stop loss and capital management
When we reach the first target, save some profit and then change the stop to entry
Comment if you have any questions
Thank You

Cosmos (ATOM) formed bullish Gartley for upto 12.50% pumpHi dear friends, hope you are well and welcome to the new update on Cosmos (ATOM) coin with US Dollar pair.
Recently we caught more than 13% pump of ATOM as below:
Now on a 4-hr frame, ATOM has formed a bullish Gartley move for the next price reversal.
Note: Above idea is for educational purpose only. It is advised to diversify and strictly follow the stop loss, and don't get stuck with trade.
