Atom Idea | Daily Time-frame Atomusdt
Atomusdt facing doubl resistance ( Trendline + Horizontal ) I am expecting a drop again towards daily support again but incase of breakout from here atom will fly
Dyor , always wait fir confirmation
ATOMUSDT trade ideas

Cosmos shortCosmos bounced off the descending trendline. Asset bounced off the resistance level. Bearish movement to support level at 10.16 is possible.

ATOMUSDT wants new liquidityATOMUSDT faced rejection from the dynamic daily resistance level located around the 13$ area. This indicates that there was a significant amount of selling pressure in the market at that price level, which prevented the price from moving higher.
Currently, the market is testing the 4-hour support level located around the 11$ area. If the price of ATOMUSDT fails to hold this support level, it could potentially trigger a downtrend in the market, according to the trading rules laid out by Plancton
If the price of ATOMUSDT does break below the 11$ support level, it would likely signal a shift in market sentiment and create an opportunity for short trades. However, it's important to note that the cryptocurrency market can be highly volatile and unpredictable, so traders should always exercise caution and use risk management strategies to protect their capital.
–––––
Follow the Shrimp 🦐
Keep in mind.
🟣 Purple structure -> Monthly structure.
🔴 Red structure -> Weekly structure.
🔵 Blue structure -> Daily structure.
🟡 Yellow structure -> 4h structure.
⚫️ Black structure -> <= 1h structure.
Follow the Shrimp 🦐

#ATOM | Short| Trade Set-Up | Video Analysis#ATOM | Short| Trade Set-Up
Entry Conditions
| Bearish Signal
| Broke & Rejected from the 20 & 50 D.EMA
| Lost Key Support
| Testing final support
| Broken Local CVD Trendline
| Don't Forget To Hit Follow To Never Miss An Idea |
| Please Support By Giving This Idea a Boost |

#ATOM | Short| Trade Set-Up#ATOM | Short| Trade Set-Up
Entry Conditions
| Bearish Signal
| Broke & Rejected from the 20 & 50 D.EMA
| Lost Key Support
| Testing final support
| Broken Local CVD Trendline
| Don't Forget To Hit Follow To Never Miss An Idea |
| Please Support By Giving This Idea a Boost |

ATOM BEARISH IF BREAKS DAILY SUPPORTATOM/USDT on 1D is testing the support zone of descending triangle.
BEARISH IF WE BREAK BELOW THE ONE.

ATOMUSDTHello dear friends,
*Mars Signals Team wishes you high profits*
This is a one-day-time frame analysis for ATOMUSDT
Obviously there wee see some areas on the top including R3, R2, and R1 that all are our resistance areas and demonstrate the disability of the price to rise at various points. And we have S1 and S2 as our support areas in the current chart with their support of price at several points even in the past. The price was supported well at S1 line at some points and after each support it could rise to higher amounts. But by having the disability to rise more at 1 line, it was on a decline again and is now under fluctuation over S2 area. This is a corrective trend for the price at the present, it was rejected again via a negative Marubozu candle to lower amounts which means the high pressure of sellers. Now it is moving and fluctuating over S1 area and it is predicted to have a range at this point and after a fall and then a recovery, besides providing us some signs, it we would have a rising trend to happen. If the last candle is closed over S1, then we expect more rise to happen. But if the formation of the last candle is done below S1 line, then the possibility of a decline is high then. Either the price is able to be supported at R1 and by moving toward R2 and breaking this area upward and retesting and providing more fixation and rising signs for us, we will expect more increase for it to touch R3 (which is another proper point for saving your profits). By the time the price loses the support at R1 and via falling below it and losing the support, more decline will take place down to S1. But remember that by the time the price loses S2 support, it will touch more lower amounts as more decline. Remember to wait for the price to be supported at S2 and on its recovery trend and returning process, you can enter trading and put your sale orders. It is better to check every detail and information before doing anything. If you are looking for wise trades and less risky ones, our suggestion will be following our regular updates all the time.
Warning: This is just a suggestion and we do not guarantee profits. We advise you to analyze the chart before opening any positions.
Take care

ATOM next support zonesThe ATOM chart appears to be relatively straightforward at the moment. If it breaks the $10 support level, we can anticipate a potential decline to the next demand zones, which are situated at around $8.43 and $5.55. I recommend exercising patience and waiting for the price to reach the demand zones before making any investment decisions. By doing so, you may be able to purchase at a lower price and achieve a more profitable return.
In my opinion, it is better to buy in strong zones rather than pivots.

atom long zonemarket structure is bull and pair came to its support zone(purple box) .
so you better be trading it. good luck

#ATOMUSDT #LQR #TOBTC #LaqiraProtocol
● You could get up to 45% ✌️😉 profit from the April 17 analysis
• Support and resistance are specified in the chart
• Levels are obtained from the intersection of the fib and static levels
• You can open a position after confirmation
• This analysis is not an offer to buy or sell

ATOM STRUCTURE ANALYSIS, DPrice after reaching to HH started the downtrend and after heating the demand zone, started its pullbacks that created multiple LH. It seems the power of demand zone is decreasing (deep penetration in 26APRIL) and price started its consolidation.

ATOMUSD ❕ fixed above the channelATOM has fixed above the channel and returned to the range.
The RSI chart is moving in the buy zone (4H, 1H and 30m TFs)
I believe the asset will bounce after it fixes in the range.

✅TS ❕ ATOMUSD: downtrend channel✅✅ ATOM could not break the structure.
The asset returned to the descending channel.
The price will continue its decline. ✅
🚀 SELL scenario: short to 10.591 🚀
----------------------------------------------------------------------------
Remember, there is no place for luck in trading - only strategy!
Thanks for the likes and comments.

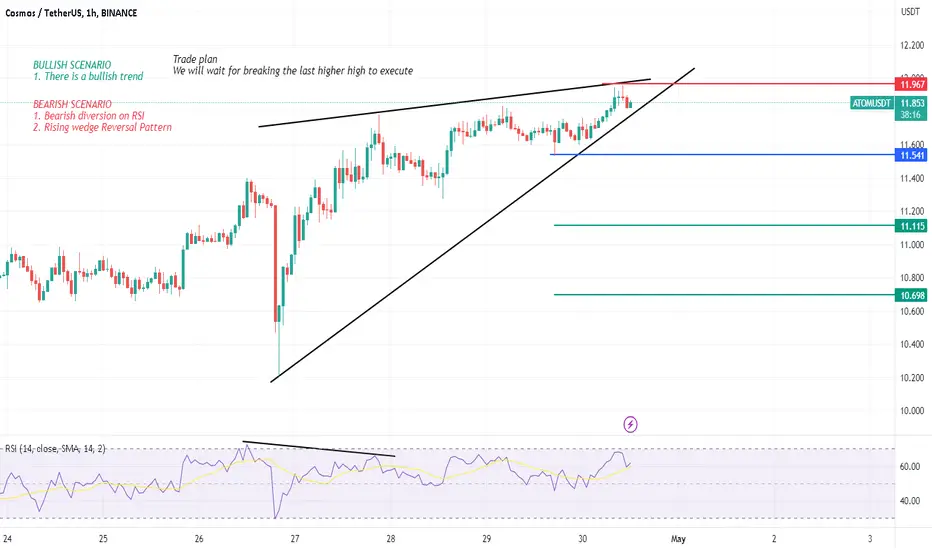
ATOMUSDT-1H-TREND REVERSALATOMUSDT is making higher highs and higher lows but there is a diversion on RSI index and it is also making a rising wedge which may cause in trend reversal
Cosmos (ATOM) analysis: New rubric "Where is the BOTTOM?"Hello, everyone!
Let's continue to analyze fundamentally strong crypto assets which I am going to buy at the very bottom. Now it's time to predict where the bottom for ATOM is gonna be.
Using trading chaos approach I defined the Elliott waves with the order you can see on the chart. You can tell me that wave 2 is too deep, but I have the evidence that it's correct. Look at the Fibonacci extension 1.61 - the natural wave 3 target. Price has reached this target perfectly. After that price has printed the wave 4 which is represented as a triangle correction. I think now ATOM is in wave 5 because it broke down the key fractal level.
The most important question: where is the gonna be the bottom. My answer is $3. There I will buy ATOM for the new bull run. This target was calculated according to the Tom Joseph's methodology. Bill Williams linked to his approach that's why I use it here.
Best regards, Ivan
________________________________
Follow me and never miss update👍

Atom Long setupAtom is at demand zone. broke the internal bearish structure. waiting for it's retracement

Cosmos expected Price is 13.4$ Hello traders ,
Cosmos has crossed the trend , the next expected movement is crossing 13.0 after correction between 12 to 11.5 .
Trade safe ,


ATOMUSDT Support and resistance on the 1-day chartSupport and resistance on the 1-day chart
we have support at 8,351 and resistance at 15,789
Buy profit 88%, sell profit 46%

✅TS ❕ ATOMUSD: kept the support level✅✅ ATOMUSD is moving near the upper limit of the channel.
The chart has once again held the support level.
We believe that the price of the asset will continue to rise. ✅
🚀 BUY scenario: long to 12.639 🚀
----------------------------------------------------------------------------
Remember, there is no place for luck in trading - only strategy!
Thanks for the likes and comments.

Cosmos is in a potential accumulation stage - Cosmos is in a potential accumulation stage (market structure). You never know if the price will break out higher or continue the downtrend.
Next, there’s a buildup formed around the 11.49 resistance area.
This tells you one of two things:
1)The buyers are willing to buy at higher prices, even at resistance; or
2) there’s a lack of selling pressure, and that’s why the price is unable to move lower. Whatever the case, this is a sign of strength.
So to trade the breakout, you can go long with a buy stop order above the highs of resistance (entry trigger). Your stop loss goes 1 ATR below the lows of the buildup (exit when you’re wrong) and you can trail your stop loss to ride the potential trend (exit
when you’re right).
Reference: The rights here for this is part of the learning course and trading strategies that can be found here: www.tradingwithrayner.com

ATOM 💥 4D Bull Flag Break💥out and at Retest Hello Traders,
This Beast looks like its ready for take off 🚀🚀🚀
At the time of charting Cosmos price today is $13.29 USD with a 24-hour trading volume of $229,589,700 USD. We update our ATOM to USD price in real-time. Cosmos is up 3.32% in the last 24 hours. The current CoinMarketCap ranking is #20, with a live market cap of $3,805,684,402 USD. It has a circulating supply of 286,370,297 ATOM coins and the max. supply is not available.
10.644 in in invalidation
Always DYOR
Stay Safu, Let that sink in.

Atom (cosmos)Very nice chart , dropped down , recovered , break up .
I cant see more than upside here .
Good luck
