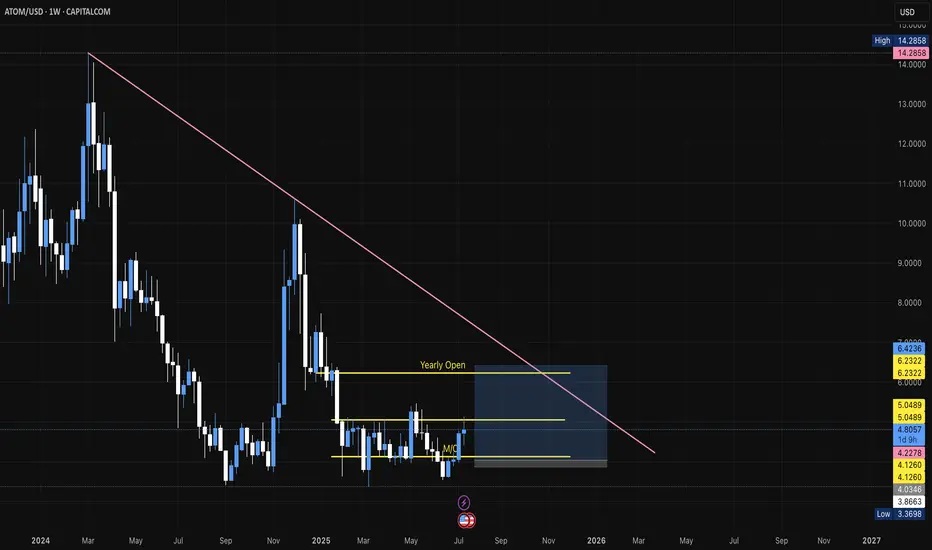
ATOM Swing TradeAs BTC dominance is sliding, which is an early alt season, I'm preparing some bids anticipation of pullbacks. One of the coins that caught my attention is ATOM.
Structurally, it looks bottomed, reclaiming key support around the M/O. My initial target is the Yearly Open, where I’ll take profit and t
Key stats
About ATO
Related coins
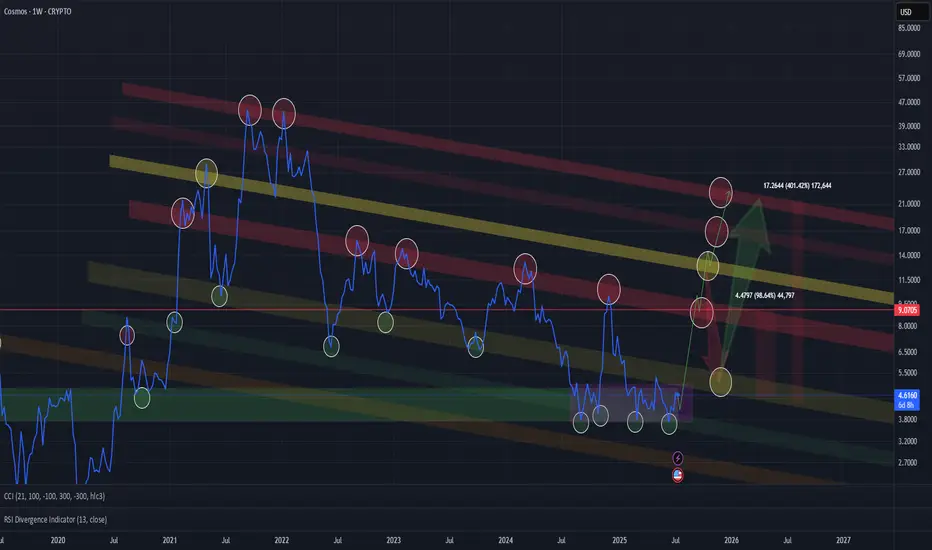
100% here is what ATOM is going to doJ/k in the title of course but here's a fun prediction. Would awesome if I get it even a little bit right.
There's a small cup n handle (blue), with a breakout and retest. That's where the price action sits right now.
Zoom out a bit and there's a larger cup (yellow) that could form a handle of i

ATOM (COSMOS)🔹 Accumulation Phase in Play
We’re currently sitting in a clear accumulation zone — price is holding steady, showing signs of position-building by stronger hands.
📈 The next key areas are distribution zones, all of which are already marked on the chart. If you're entering a position now, odds are h
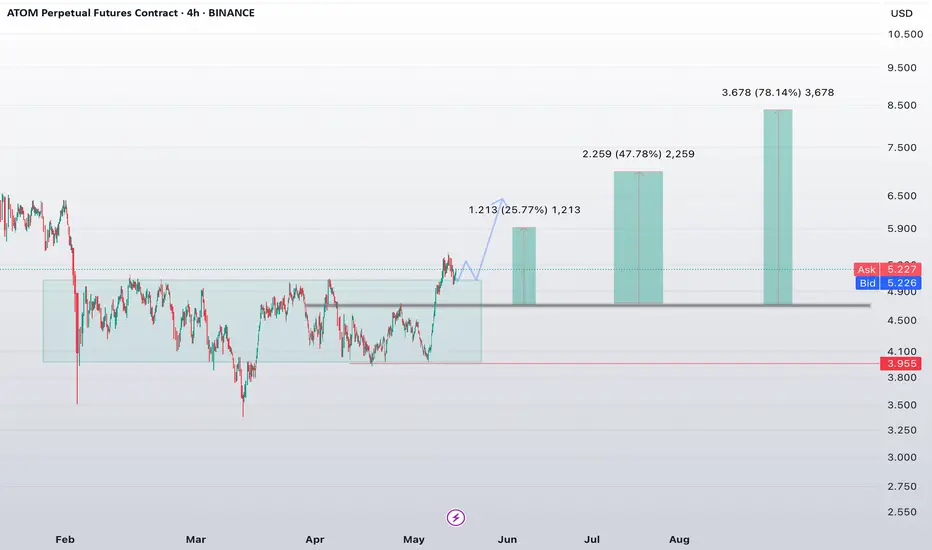
ATOM confirms the breakout!⚛️ NASDAQ:ATOM confirms the breakout!
We've officially broken out of the multi-month range and completed a successful retest from above — the path upward is now open. 🚀
✅ Current price: $5.22
📉 Retest of the $4.80–$5.00 zone held perfectly
📈 Targets on the horizon:
$6.53 (+25.7%)
$7.53 (+47.8%
$ATOM is waking up!⚛️ NASDAQ:ATOM is waking up!
Price is back above $5, and this looks like just the beginning. The daily chart shows a clear breakout from a long accumulation zone. 🚀
✅ Current price: $5.05
📈 Upside targets based on technicals:
$6.26 (+25.77%)
$7.31 (+47.78%)
$8.73–$8.89 (+78%‼️)
📊 Support zone

Global plan for ATOMIn this video I considered the global possible price movement, also made possible scenarios for the current week
Write a comment with your coins & hit the like button and I will make an analysis for you
The author's opinion may differ from yours,
Consider your risks.
Wish you successful trades!

Atomusdt long to $4.73+Just now opened a long position on atom.
Targeting $4.73+
Aiming to take partial at $4.586 area
then move stop to BE and hold the rest. Potentially scaling back in again if doesn't push straight to tp.
4.47 stop or lower.

ATOM / USD🔹 Current price: $4.46
ATOM is trading below its averages and indicators are showing a reversal. I expect short-term gains, especially given the fundamental improvements.
Fundamental Factors:
• Activation of the IBC protocol in February 2025, providing interoperability with Ethereum and BSC.
• Ex

ATOMUSD: Channel Down bottomed. Strong buy signal.Cosmos turned bullish on its 1D technical outlook (RSI = 60.498, MACD = 0.008, ADX = 27.015), which raised 1W to a neutral state. This is perfectly aligned with the market structure at the moment, which is a technical rebound at the bottom of the 3 year Channel Down. The 1W RSI is on a HL trendline,

(ATOM) cosmos "wave count"Long form wave count would appear to be in trend with an entirely new cycle for Cosmos, potentially, although I did not go all the way back to the origin of the company which is necessary to get a true depiction of history. Is the history of a company based on short lived moments or is there any kno

See all ideas
Summarizing what the indicators are suggesting.
Oscillators
Neutral
SellBuy
Strong sellStrong buy
Strong sellSellNeutralBuyStrong buy
Oscillators
Neutral
SellBuy
Strong sellStrong buy
Strong sellSellNeutralBuyStrong buy
Summary
Neutral
SellBuy
Strong sellStrong buy
Strong sellSellNeutralBuyStrong buy
Summary
Neutral
SellBuy
Strong sellStrong buy
Strong sellSellNeutralBuyStrong buy
Summary
Neutral
SellBuy
Strong sellStrong buy
Strong sellSellNeutralBuyStrong buy
Moving Averages
Neutral
SellBuy
Strong sellStrong buy
Strong sellSellNeutralBuyStrong buy
Moving Averages
Neutral
SellBuy
Strong sellStrong buy
Strong sellSellNeutralBuyStrong buy
Displays a symbol's price movements over previous years to identify recurring trends.
Curated watchlists where ATOUSD is featured.

Gen 3 crypto: A new day dawns…
25 No. of Symbols

Interoperability Crypto: Communication station
14 No. of Symbols

Proof of Stake: Seeking validation?
26 No. of Symbols

Smart contracts: Make the smart decision
36 No. of Symbols

Staking Coins: Pick up a stake
18 No. of Symbols
See all sparks
Frequently Asked Questions
The current price of ATO (ATOM) is 4.12040000 USD — it has risen 0.60% in the past 24 hours. Try placing this info into the context by checking out what coins are also gaining and losing at the moment and seeing ATOM price chart.
The current market capitalization of ATO (ATOM) is 1.61 B USD. To see this number in a context check out our list of crypto coins ranked by their market caps or see crypto market cap charts.
ATO (ATOM) trading volume in 24 hours is 186.26 M USD. See how often other coins are traded in this list.
ATO price has fallen by −8.62% over the last week, its month performance shows a 7.78% increase, and as for the last year, ATO has decreased by −28.73%. See more dynamics on ATOM price chart.
Keep track of coins' changes with our Crypto Coins Heatmap.
Keep track of coins' changes with our Crypto Coins Heatmap.
ATO (ATOM) reached its highest price on Sep 20, 2021 — it amounted to 44.70800000 USD. Find more insights on the ATOM price chart.
See the list of crypto gainers and choose what best fits your strategy.
See the list of crypto gainers and choose what best fits your strategy.
ATO (ATOM) reached the lowest price of 0.05523000 USD on Dec 3, 2023. View more ATO dynamics on the price chart.
See the list of crypto losers to find unexpected opportunities.
See the list of crypto losers to find unexpected opportunities.
The current circulating supply of ATO (ATOM) is 390.93 M USD. To get a wider picture you can check out our list of coins with the highest circulating supply, as well as the ones with the lowest number of tokens in circulation.
The safest choice when buying ATOM is to go to a well-known crypto exchange. Some of the popular names are Binance, Coinbase, Kraken. But you'll have to find a reliable broker and create an account first. You can trade ATOM right from TradingView charts — just choose a broker and connect to your account.
Crypto markets are famous for their volatility, so one should study all the available stats before adding crypto assets to their portfolio. Very often it's technical analysis that comes in handy. We prepared technical ratings for ATO (ATOM): today its technical analysis shows the sell signal, and according to the 1 week rating ATOM shows the strong sell signal. And you'd better dig deeper and study 1 month rating too — it's sell. Find inspiration in ATO trading ideas and keep track of what's moving crypto markets with our crypto news feed.
ATO (ATOM) is just as reliable as any other crypto asset — this corner of the world market is highly volatile. Today, for instance, ATO is estimated as 1.60% volatile. The only thing it means is that you must prepare and examine all available information before making a decision. And if you're not sure about ATO, you can find more inspiration in our curated watchlists.
You can discuss ATO (ATOM) with other users in our public chats, Minds or in the comments to Ideas.