TRADE PLAN FOR ATOMHello traders , atom breakdown for all options of buy levels with out trade plan.
from the chart we expect a continuation in the channel and in case next levels are indicated.
tradehubng
ATOUST trade ideas

📈ATOM: Potential Long Opportunity on 4-Hour Timeframe💎🔍Today, let's focus on Cosmos (ATOM) on the 4-hour timeframe, where it has reached support at $10.714. Concurrently, it's consolidating around this support level while the RSI indicator shows positive divergence, indicating potential bullish momentum. Moreover, the decreasing volume in red candles suggests bullish volume divergence.
📈For long positions, the activation of RSI divergence with a breakout above $42.49 confirms the signal. The next resistance lies at the RSI midline, or $11.125, where a candle close above this level could signal entry for long positions.
✅Setting our initial target with a risk/reward ratio of 2, we aim for a price target of $12.745. If the price reaches this level, profit-taking could be considered.
📉Considering short positions, it's essential to note that strong trends often accompany significant divergence. However, without substantial selling volume, it's challenging to confirm stronger selling pressure. Confirmation would entail multiple red candles with high volume.
🛑For short position targets, the initial risk/reward ratio of 2 could be applied, followed by considering support at $9.734.
📝Overall, Cosmos presents a potential long opportunity, supported by technical indicators and price action around key support levels. Short positions should be approached cautiously, awaiting confirmation of increased selling pressure.
🧠💼It's important to acknowledge the inherent risks in futures trading, with the potential for margin calls if risk management is neglected. Always adhere to strict capital management principles and utilize stop-loss orders, ensuring that the initial target offers a risk-to-reward ratio of 2

ATOM's Silent UptrendATOM is a nice buy, touching its long term trendline, and doesn't react too negatively to market mishaps. We've already broken the long term resistance trendline so, the top of the trendline should be a place to look forward to.

#ATOMUSDT SHORT ⬇️SHORT #ATOMUSDT from $10.642
2h TF. The coin formed a bearish triangle formation with the highs being squeezed along the trend line to the support level, showing the strength of sellers. Since the level has been tested several times, I expect to see unrealized liquidity behind it, which will allow the downward trend to continue for a short time.
I am waiting for the formation of consolidation near the level and an impulse movement on the activity.


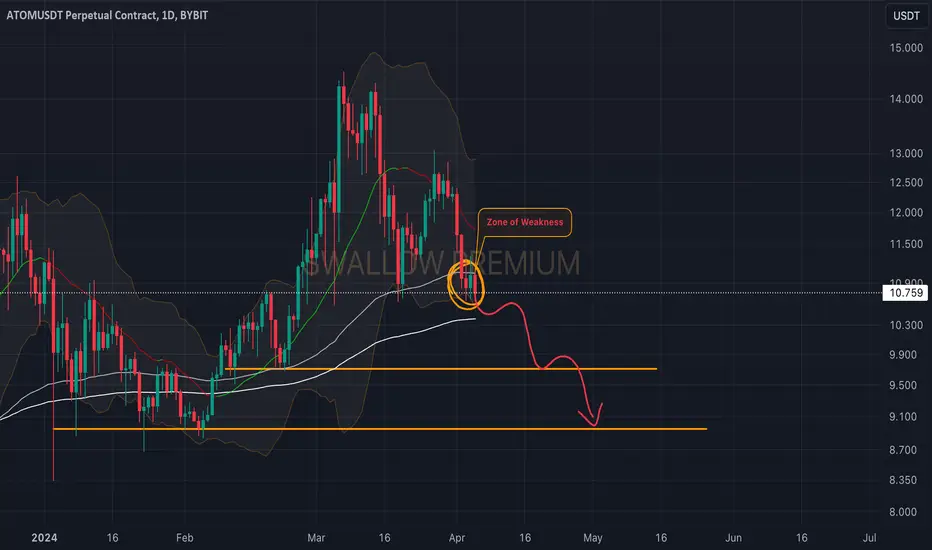
Cosmos(ATOM): Breaking 100EMA And Securing it Right NowCosmos is still near 100EMA and not showing any remorse towards buyers.
As we slowly break and secure this zone, we see a good chance for further moves to the lower zone here!
Swallow Team
atomusdtThe price is hitting the trend line that was broken earlier
We have to see if the price can go back up!! I think it should take an upward path
I am waiting for the return of the price

ATOM long ATOM is bouncing off the support level and the ascending trendline. Bullish movement to resistance level at $14.3 is expected to happen next

ATOM eaHi.
ATOMUSDT
Today, I want to analyze ATOM for you in a Weekly time frame so that we can have a SHORT-term view of ATOM regarding the technical analysis. (Please ✌️respectfully✌️share if you have a different opinion from me or other analysts).
🔵We have a Bullish Structure here
ATOM broke out the triangle downtrend 🤔
Pullback to the broke out trend line.
Now stabilize the price above the support trend line
✅ Pullback.
🟢 High potential areas are clear in the chart.
Stay awesome, my friends.

ATOM/USDT Primed for an Exponential Rally? 👀🚀ATOM Analysis💎Paradisers, it's time to zone in on #ATOMUSDT as it gears up for a potential bullish turn from its support zone, signaling a promising uptick.
💎Riding the waves of an ascending channel, MYX:COSMOS stands on the brink of testing the support level at $10.19. A notable decrease in volume at this crucial point hints at the likely extension of the bullish trajectory from $10.19, underscored by a volume spike suggesting a momentum shift could be on the horizon.
💎Conversely, if #ATOM's price breaks below this pivotal support, a strategic recalibration will be in order, as we anticipate a bullish resurgence from the next support level at $8.87. Should NASDAQ:ATOM struggle to initiate a bullish phase from this juncture, a further descent may be inevitable.
💎Staying ahead requires vigilance and adaptability as we navigate the evolving dynamics of the #ATOM market, prepared to adjust our strategies accordingly.

ATOM-VIP SIGNALATOM
LONG
X10-X20
We have two entrances
I marked the first entry with EP1
If he can break out the orange resistance
We take long with 10-20 leverage
And our stop will be under the support of white color
That is, under the range that is called
SL-EP1
LT is
This is from the first entry
The second entry is also characteristic
If it reaches its limit, take long
Pay attention, for the second entry, only reaching the limit, not breaking out!
I also specified a stop for the second entry
Pay attention if the first login is activated
The second entry will be canceled altogether
And the second entry is for now
The first entry will be cancelled
Good luck

Exploring Renko Charts: Simple Trading Strategies for Success Today, I'm excited to introduce you to two effective trading strategies designed for Renko charts. Renko charts, unlike traditional Japanese candlestick charts, focus solely on price movements, offering traders a unique perspective on market trends and opportunities. Before diving into the strategies, let's first understand the basics of Renko charts and how they differ from Japanese candlestick charts.
Renko charts are renowned for their:
Absence of time: Renko charts disregard time intervals, concentrating solely on price movements. This feature helps filter out market noise, allowing traders to identify clear trends.
Uniformity: Each brick on a Renko chart represents a fixed price movement, ensuring uniformity across the chart. This consistency aids in trend identification and reversal spotting.
Trend identification: Renko charts excel at identifying trends due to their focus on price movements. Traders can swiftly discern trend reversals or continuations by analyzing brick patterns.
Reduced noise: By filtering out minor price fluctuations, Renko charts offer cleaner data, making it easier for traders to identify significant price movements and trends.
In contrast, Japanese candlestick charts focus on time intervals and include all price movements within the selected period. Both chart types have their advantages, but for our strategies, we'll be using Renko charts.
Now, let's delve into the strategies:
1. Buy Green, Sell Red (with and without 13 EMA):
This straightforward strategy involves buying when a green candle appears and selling when a red candle emerges.
Option 1: Implement this strategy with a 13 EMA (Exponential Moving Average). Buy when a green candle closes above the 13 EMA line and sell when a red candle touches the 13 EMA line.
Option 2: Execute the strategy without the 13 EMA. Simply buy on green and sell on red.
While Option 1 may yield slightly delayed entries and exits, it provides additional confirmation, especially during volatile market conditions.
Consider automating this strategy with an algorithmic trading bot for seamless execution.
2. Strategy that forecasts the market?: This strategy tells you if the market will go up or down after a important for example economic meeting!
So, if you are interested in this strategy than write down in the comment and like (boost) this educational idea, if we get 100 likes (boosts) than I will make Part 2.
Please note: When you have a basic plan, than you can just open Renko chart above 1 day time frame, you can also work good on 1 day, but if you want to see Renko chart on Intraday time frame than you need to have Premium plan. Upgrade now for intraday best experience using RENKO chart: Upgrade now

ATOM bullrunHi!
I've spotted some exciting activity in ATOMUSDT. There may be a Bull Run in the next few weeks.
We had a breakout candle at the beginning of March with volume.
Now, the chart is accumulating for the next move. It is worth putting a long trade if we see an increase in momentum and volume in the lower timeframes (4h/1D).

ATOM//USDT bullish continuation from support? 🚀ATOM Analysis💎 Paradisers, pay close attention to #ATOMUSDT as it reveals an intriguing pattern. Currently, we're evaluating key resistance levels, which could potentially lead to a bullish continuation from the critical support at $11.857. We remain on standby, waiting for the opportune moment before executing our strategy.
💎 In the event that MYX:COSMOS loses momentum at the support level, we have a bullish scenario in mind: a turnaround from the lower support at $11.152. This level boasts substantial liquidity, evidenced by previous robust upward movements and significant green candles.
💎 However, should the price decline below this secondary support, it may signal a shift toward bearish territory, accompanied by increased selling pressure. As we closely monitor the #ATOM market behavior, staying alert and adaptable is essential.

ATOMUSDT BULLISH CONTINUATIONDaily Buying Zone (10.65 to 10.98): On the daily timeframe, you've identified a buying zone for ATOM/USDT between $10.65 and $10.98. This range suggests a level where significant buying interest has historically emerged, possibly acting as a support zone. Traders often look for such areas to enter positions, anticipating a bounce in price from these levels.
Fresh Buying Zone for 4-Hour (11.2 to 11.4): Additionally, on the 4-hour timeframe, there's a fresh buying zone identified between $11.2 and $11.4. This zone indicates a recent area where buying pressure has been observed, possibly signaling renewed bullish momentum.
Respecting Trendline: You've mentioned that ATOM is respecting a trendline, which adds further confluence to the bullish scenario. When a cryptocurrency respects a trendline, it suggests that the price is following a certain direction, reinforcing the validity of the trend.
Expected Rally of 34%: It's noted that the expected rally in ATOM/USDT is around 34%. This indicates the potential upside movement in price from the identified buying zones to the anticipated peak of the rally. Such projections are often based on technical analysis indicators, historical price movements, and market sentiment.
Two Target Prices: You've set two target prices, suggesting levels at which you plan to take profits or partially close your position. These target prices are likely based on technical analysis indicators, such as resistance levels or Fibonacci extensions, and help traders manage their trades effectively by having clear exit points.
In summary, the analysis suggests a potential trading opportunity in ATOM/USDT, supported by identified buying zones, trendline respect, and an expected rally. By setting target prices and managing risk, traders can navigate the market with a clear plan, aiming to capitalize on potential price movements while protecting their capital from adverse outcomes.

Cosmos(ATOM): Trend is Bullish For Now!Cosmos caught our attention with a nice bounce after toching that trend and 100EMA line. If we hold this kind of movement here, then we will see potential further movement to higher zones and steady bullish growth here with higher highs and lower highs.
Again, if we see a weakness near a trend and a price to break it, then we will most likely see a sharp movement to lower zones!
Swallow Team

Cosmos(ATOM): Good Bounce From 100EMASince last time, we have had a nice bounce from 100EMA, which has been holding strong as of now.
We are looking here for some further movement to form a new higher high zone from where we will be looking for a correctional movement. We are not going to long this one until the next top as we might still see a fakeout!!
Swallow Team

ATOM USDTATOM Setup. After a confirmed breakout from the marked zone in green, we could take an entry at 13.266. Remember stop loss is your friend. Everything is on the chart.
Entry 13.266
S.L 12.195
T.P 1 13687
T.P 2 14572
T.P 3 15.494
T.P 4 16.162
T.P 5 17.209

ATOM COMING PUMP!!!Atom has broken line resistance, lean now as support and have the opportunity for sky rocket. Be carefull if bitcoin make a big correction. It will lead to wait a little bit for the pump. But here you have a good opportunity. Remember investing doing DCA.

ATOM Coin Update!Hello, friends! Today I am revisiting the ATOM coin and want to share with you some new data and my forecasts for this exciting cryptocurrency.
In my previous post, I detailed what ATOM is and how to earn additional income through staking to qualify for new coin distributions. But today we have exciting news - the team on Twitter has announced that we will receive a bonus on April 2nd! Let's see how this will affect the coin's price
In the meantime, I want to show you an interesting concept of this coin's movement using graphical data. I believe that analyzing fractals can help us envision what may lie ahead in the future. So here's a chart with a similar fractal - take a look, analyze, and find your entry and exit points in the market.

ATOM - USDT Achieved TP LVL 🔥 27/03/24Absolutely smashing results! 🔥🔥🔥
Trade took over 6 days & in the final "push" did hit TP @ 12.601. With Entry @11.470 it left us with a nice profits!
It was achieved using purely technical analysis only...
PS: not able to post many more trades, which one in the progress or just endup in profit , cos of lack spare time , sorry....over incoming weekend I will try to share majority of them ..
Live Long & Prosper!🖖

ATOM / Cosmos ecosystem : what now?Following my 2022 idea on the Cosmos ecosystem, we now have
1. Entered the area highlighted
2. A signal (bullish W div & breakup W/M)
-> The idea is now ready to be executed into a trade with targets and SL.
This is a long-term trade, so there is absolutely NO NEED to overmanage it. This is better executed as a spot-holding, which could be partially staked for a small extra APY.
Cheers

