Cosmos longCosmos bounced off the support level. Asset broke trough the resistance level. Bullish movement to resistance level at 12.1 is possible.
ATOUST trade ideas

#Atom | #Usdt#Atom | #VIP_Pack | #NUM_SV36
Long
Entry : 11.075~11
Tps : 11.36 / 11.77 / 12.34
SL : 10.51
Don’t risk more than 1% of your capital.

Atom bomb is ticking; tik tok tik tokWhenever the Capitulation even happens we gonna get another chance to buy/accumulate at cheaper price!!

🔥 ATOM 10 Month Triangle Break Out: Weakness IncomingIn my last ATOM analysis I already talked about this triangle and that I expected some kind of bounce. My initial target was the top resistance of the triangle, but after a 15% move we fell back down.
Since we've now fallen through a 10-month support, I think that we're going down more.
I'm looking at 10 and 9 usd targets.


[cosmos] by qikoToday, I bring forth a fascinating analysis of ATOM.
Since its low in March 2020, ATOM has experienced an impressive 4100% increase at its peak. Subsequently, ATOM descended in five waves, with the 5th wave truncating, signifying the inception of a downtrend.
I anticipate the swing highs to be surpassed for Wave B before resuming the downtrend to complete Wave C.
Wave B Target: ~ 26
Wave C Target: ~ 3

ATOM-USD✦SHORT TRADE SETUP✦ONE HOUR✦ATOM (COSMOS) is moving in a bearish direction and making a Bearish Flag Continuation Pattern. In addition, the presence of divergence is negative. Therefore, this trade setup is designed to have a SHORT TRADE opportunity over one hour time frame. Projected Price is given in dashed line. Risk Reward Ratio is set to 2% of the total portfolio.

ATOMUSDT, Lower high major trend reversal? ATOMUSDT / 1D
Hello traders, welcome back to another market breakdown.
ATOMUSDT has been showing some kind of accumulation pattern which might lead to a short squeeze.
I'm waiting for a retest if I get it.
Trade safely,
Trader Leo.

ATOM USDTLocation: 0.786-0.886
Indicators: Need to wait crossover
Structure: Seeking for w-shape
Aim: 11.9$

ATOM can increase a lot pretty soon!ATOM is going to create a big double bottom pattern which means the price shall increase a lot ! the second Bottom will be created soon and afterward we shall expect the price to increase as much as the measured price movement (the length between the top and the bottom of the pattern) and reach 15.85$
_ _ _ _ _ _ _ _ _ _ _ _ _ _ _ _ _ _ _ _ _ _ _ _ _ _ _ _ _ _ _ _ _
🌍Thank you for seeing idea .
Have a nice day and Good luck.

ATOM/USDT Secondary trend. Right shoulder area.Secondary trend. Time frame 1 week. Logarithm. Showing % of potential reversal zones depending on the overall situation in the crypto market.
Coinmarketcap : Cosmos
Line graph.
Local trend. Pivot zone. Time frame 1 day.
Main Trend Look at my previous idea published half a year ago by clicking on the "play" button on the price chart.
ATOM/USDT Main Trend. Channel. The important zone.

#ATOM Continue the upward trendThe triple correction is completed and the pullback to the broken trend is done.
Still susceptible to growth.

ATOM - Trendline Break & Retest
Following up on my last ATOM post, the yellow zone is serving as solid support. Price has broken the top channel trendline and has just retested it.
If we get a bullish follow-through, we may see an impulsive wave all the way to $20.
ATOM close to flying 🚀According to the analysis, the trend of the atom coin will be rising to target these three areas

is Atom ready for break out?if you look at the chart you can see a big inverse head and shoulder is formed.
this is a good sign that tells us soon or later price will break above the pattern
and rise. at the moment price is moving in a triangle too.
also price is closed above daily 200 MA signs for more upward pressure.
so either now or later we should expect more upward pressure on this Alt coin.
if you look on some other Alts you can see almost same pattern has formed.
this tells us we can expect a nice bull trend on Alt coin market soon.
the target would be the resistant levels at the case of break out this neckline.
Enjoy the market

ATOMUSD - Solid Up Trend A solid up trend has emerged in green on ATOM
This green trend has majority stayed intact and I expect it to stay that way
Moonshot after consolidation?

#ATOMIt is located at the bottom of the corner of its own long-term ascending channel.
It has corrected more than a third of the previous wave, which can be placed in the third ascending step.
You can apply for a long position until the dynamic trigger, and if the trigger fails, it can have upward targets of $18 and $22.
The bottom of the previous analysis wave will be invalidated.


#ATOMUSDT #LQR #TOBTC #LaqiraProtocol Support and resistance are specified in the chart
• Level are obtained from the intersection of the fib and static levels
• You can open a position after confirmation
• This analysis is not an offer to buy or sell

Time for a strong dipHello Traders!
Welcome back to another trade with analyst Aadil1000x.
Today we are shorting atom because of the Reversal pattern at peak.
Atom Short Now @ 12.591
Stoploss 12.998(-3.17%)
Target 1, 11.966(+5.02%)
Final Target 11.313(+10.17%)
Don't forget to hit the like button and follow to stay connected.


ATOM USDT | Short to mid term trade #ATOM/USDT
🟢Entry price: from now to 11.2 to 10.5
🟢 from 11 to 10.5 is a good entry point but if you want to get more safe I think waiting to close weekly above 12.2 or trading the breakout of 12.2 (200MA on daily frame) will be more safe.
🎯Targets:
|> 12.2
|> 13.35
|> 14.45
🔴Stop-loss: Daily close under 10
➡️Recommended risk: 0.25%
➡️Recommended Position Size: 5%
stay safe and thank you !

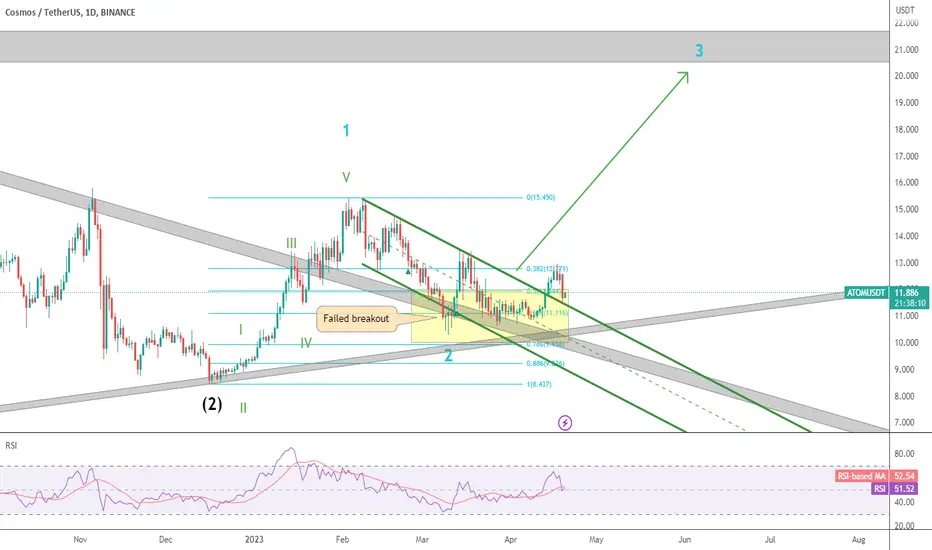
✴️ Cosmos | Multiple Signals & PatternsFirst, we have the Elliot Wave count with its impulse followed by a correction.
The correction created the Adam & Eve pattern which forms at support levels/bottoms.
Finally we have the indicators such as the strong RSI, rising volume with prices trading above EMA50 and MA200.
7 Days closing green... Normally this type of consolidation leads to strong moves, a sudden jump up.
We are about to witness something quite interesting that we haven't seen in a long while, it should be fun or I should say profitable.
Enjoy your Saturday/Sunday, depending on where you live.
You might be on break, but it is always work for me... You can still read! 😄
Namaste.
