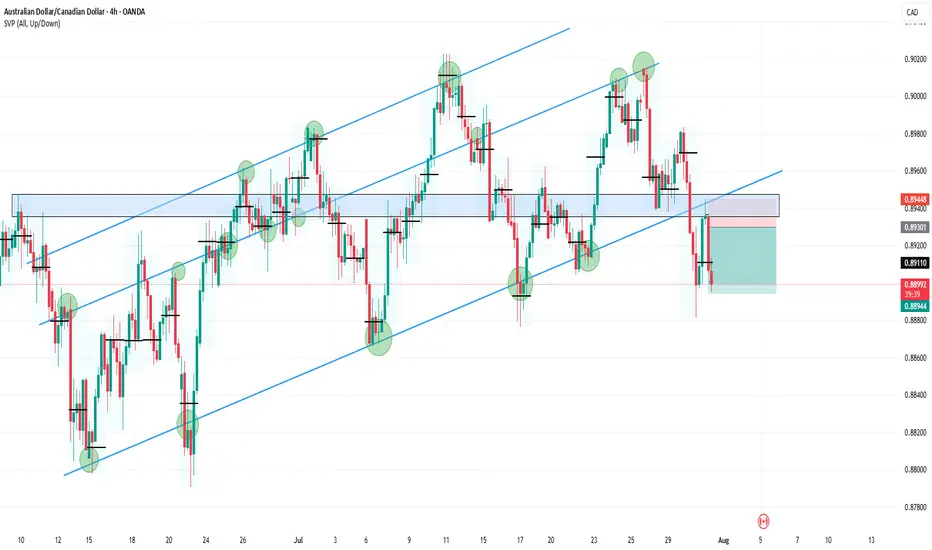
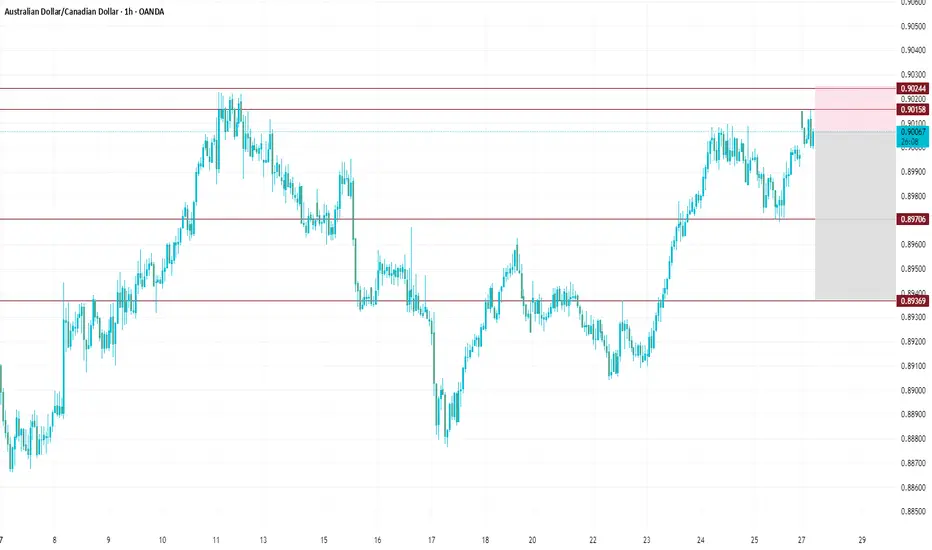
Lingrid | AUDCAD Swap Zone. Potential Selling OpportunityThe price perfectly fulfilled my last idea . FX:AUDCAD is rebounding from a strong support area after a fake break below 0.88805 and is now moving toward the descending trendline. The price is expected to test the swap zone near 0.89421, where prior support may flip to resistance. This setup favors a SELL scenario from the lower high structure within the flag and downtrend. A rejection from the trendline could resume the bearish continuation back toward support.
📌 Key Levels
Sell zone: 0.89421 – 0.89500
Buy zone: 0.88805 – 0.88600
Target: 0.88805
Invalidation: Break and close above 0.89550
💡 Risks
Bullish breakout through the descending trendline
Sharp reversal from macroeconomic news
Short-term consolidation above 0.89100 weakening momentum
If this idea resonates with you or you have your own opinion, traders, hit the comments. I’m excited to read your thoughts!
AUDCAD trade ideas

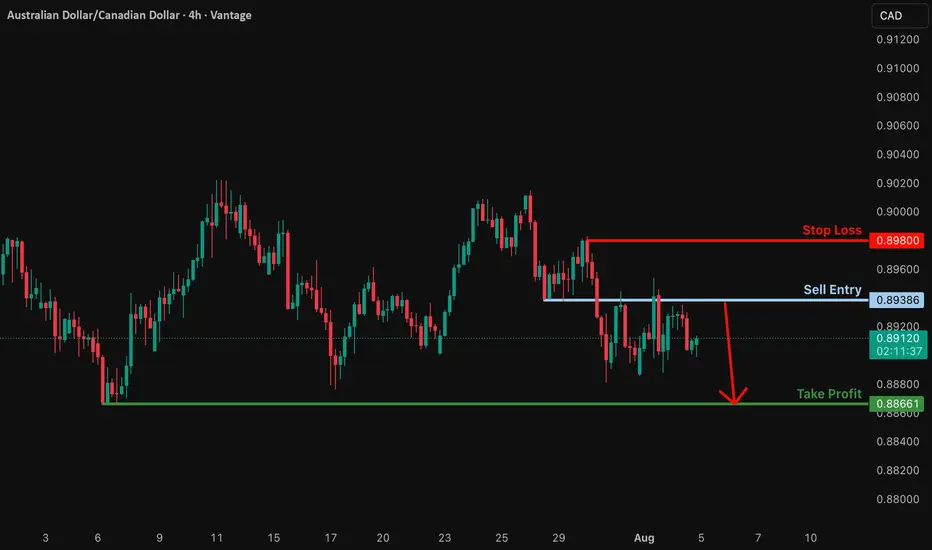
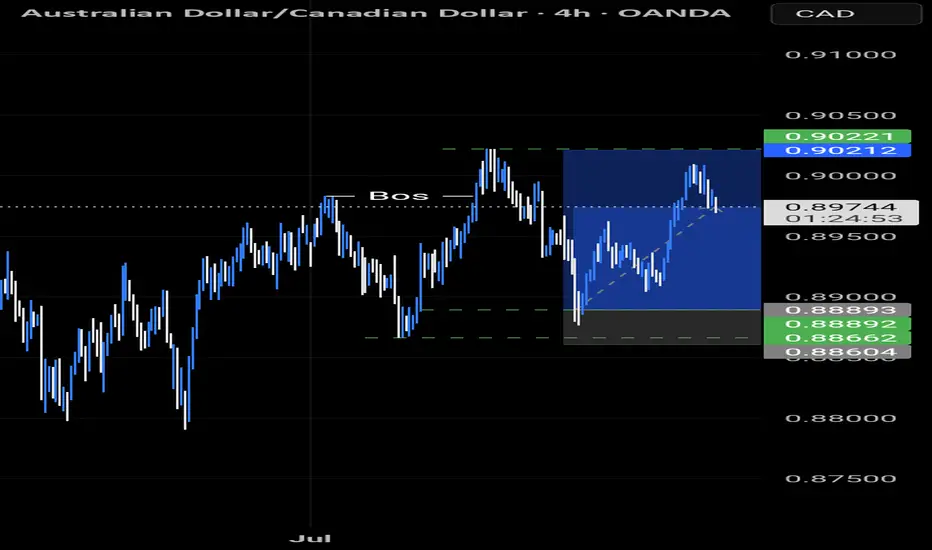
Bearish drop?AUD/CAD has rejected off the resistance level whihc is a pullback resistance and could drop from this level to our take profit.
Entry: 0.89386
Why we like it:
There is a pullback resistance.
Stop loss: 0.89800
Why we like it:
There is a pullback resistance.
Take profit: 0.88661
Why we like it:
There is a swing low support.
Enjoying your TradingView experience? Review us!
Please be advised that the information presented on TradingView is provided to Vantage (‘Vantage Global Limited’, ‘we’) by a third-party provider (‘Everest Fortune Group’). Please be reminded that you are solely responsible for the trading decisions on your account. There is a very high degree of risk involved in trading. Any information and/or content is intended entirely for research, educational and informational purposes only and does not constitute investment or consultation advice or investment strategy. The information is not tailored to the investment needs of any specific person and therefore does not involve a consideration of any of the investment objectives, financial situation or needs of any viewer that may receive it. Kindly also note that past performance is not a reliable indicator of future results. Actual results may differ materially from those anticipated in forward-looking or past performance statements. We assume no liability as to the accuracy or completeness of any of the information and/or content provided herein and the Company cannot be held responsible for any omission, mistake nor for any loss or damage including without limitation to any loss of profit which may arise from reliance on any information supplied by Everest Fortune Group.
DAILY AUDCAD SELL IDEA 📍AUDCAD Market Breakdown – ABC Setup in Play
Right now, AUDCAD is showing signs that we’ve entered the B to C leg of our ABC framework.
We had a clean consolidation phase that transitioned into a decisive expansion, textbook market behavior that aligns with the buildup and breakout principles we teach. That expansion gave us our possible “B” point, and now we’re seeing the retracement phase unfold which is the real gem for Snipress-style execution.
Price action has now tapped into a key level we’ve been watching for high-quality continuation shorts. The structure is aligning:
✔️ We’ve got the retracement
✔️ Price is reacting to a prior supply zone
✔️ Momentum is slowing near the level, a sign we may be gearing up for the “C to completion” leg
This is not the time to guess, it’s time to observe, confirm, and strike when the candle gives permission. Let the trade come to you. Stay sniper-minded. 🧠🔫

AUDCAD; Heikin Ashi Trade IdeaIn this video, I’ll be sharing my analysis of AUDCAD, using FXAN's proprietary algo indicators with my unique Heikin Ashi strategy. I’ll walk you through the reasoning behind my trade setup and highlight key areas where I’m anticipating potential opportunities.
I’m always happy to receive any feedback.
Like, share and comment! ❤️
Thank you for watching my videos! 🙏

AUDCAD SHORT Market structure bearish on HTFs 3
Entry at both Daily and Weekly AOi
Weekly Rejection at AOi
Previous Weekly Structure Point
Daily Rejection at AOi
Previous Structure point Daily
Around Psych Level 0.89500
H4 Candlestick rejection
Rejection from Previous structure
Levels 4.18
Entry 120%
REMEMBER : Trading is a Game Of Probability
: Manage Your Risk
: Be Patient
: Every Moment Is Unique
: Rinse, Wash, Repeat!
: Christ is King.

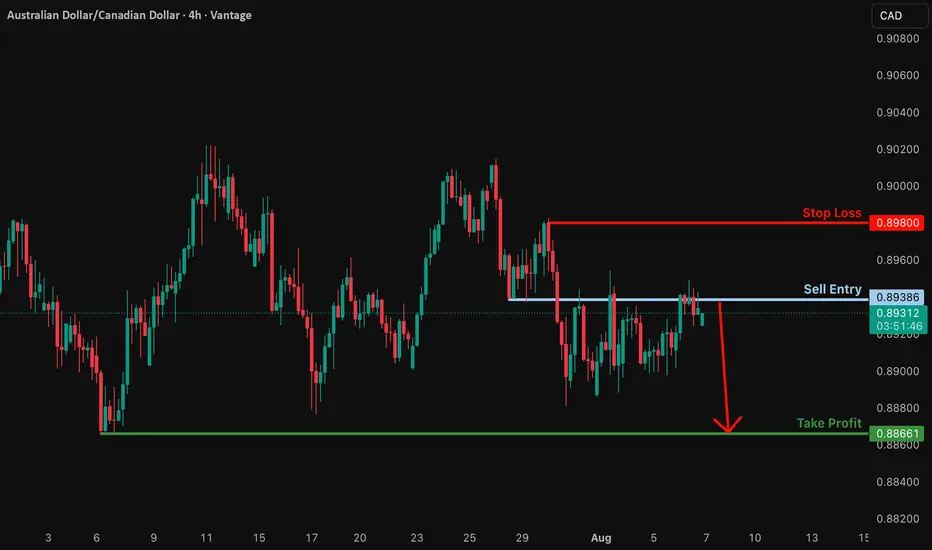
Potential bearish drop?AUD/CAD is reacting off the resistance level, which is a pullback resistance, and could drop from this level to our take-profit.
Entry: 0.89386
Why we like it:
There is a pullback resistance.
Stop loss: 0.8980
Why we like it:
There is a pullback resistance.
Take profit: 0.8866
Why we like it:
There is a swing low support.
Enjoying your TradingView experience? Review us!
Please be advised that the information presented on TradingView is provided to Vantage (‘Vantage Global Limited’, ‘we’) by a third-party provider (‘Everest Fortune Group’). Please be reminded that you are solely responsible for the trading decisions on your account. There is a very high degree of risk involved in trading. Any information and/or content is intended entirely for research, educational and informational purposes only and does not constitute investment or consultation advice or investment strategy. The information is not tailored to the investment needs of any specific person and therefore does not involve a consideration of any of the investment objectives, financial situation or needs of any viewer that may receive it. Kindly also note that past performance is not a reliable indicator of future results. Actual results may differ materially from those anticipated in forward-looking or past performance statements. We assume no liability as to the accuracy or completeness of any of the information and/or content provided herein and the Company cannot be held responsible for any omission, mistake nor for any loss or damage including without limitation to any loss of profit which may arise from reliance on any information supplied by Everest Fortune Group.
AUDCAD SHORT Market structure bearish on HTFs 3
Entry at both Daily and Weekly AOi
Weekly Rejection at AOi
Previous Weekly Structure Point
Daily Rejection at AOi
Previous Structure point Daily
Around Psych Level 0.90000
H4 EMA retest
H4 Candlestick rejection
Rejection from Previous structure
Levels 4.51
Entry 120%
REMEMBER : Trading is a Game Of Probability
: Manage Your Risk
: Be Patient
: Every Moment Is Unique
: Rinse, Wash, Repeat!
: Christ is King.

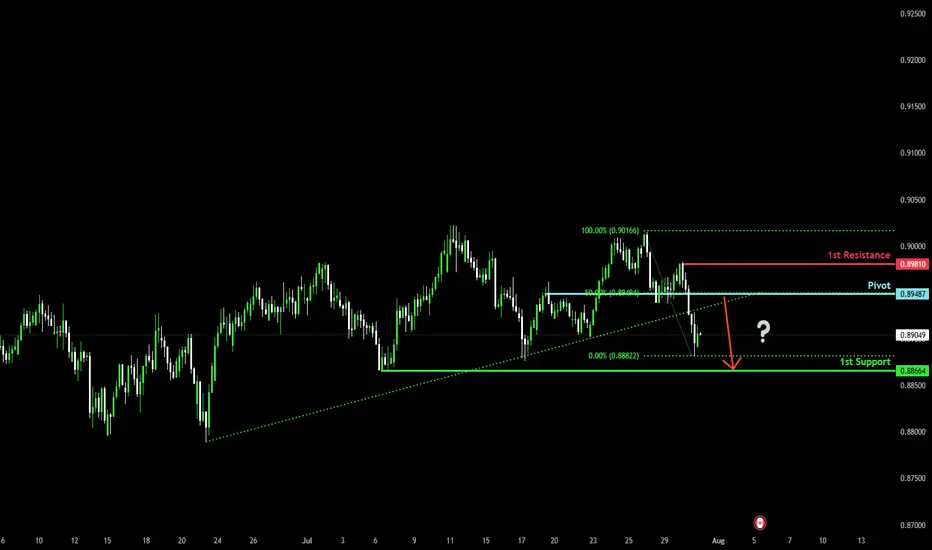
Bearish reversal?AUD/CAD is rising towards the pivot, which aligns with the 50% Fibonacci retracement and could reverse to the swing low support.
Pivot: 0.89487
1st Support: 0.88664
1st Resistance: 0.89810
Risk Warning:
Trading Forex and CFDs carries a high level of risk to your capital and you should only trade with money you can afford to lose. Trading Forex and CFDs may not be suitable for all investors, so please ensure that you fully understand the risks involved and seek independent advice if necessary.
Disclaimer:
The above opinions given constitute general market commentary, and do not constitute the opinion or advice of IC Markets or any form of personal or investment advice.
Any opinions, news, research, analyses, prices, other information, or links to third-party sites contained on this website are provided on an "as-is" basis, are intended only to be informative, is not an advice nor a recommendation, nor research, or a record of our trading prices, or an offer of, or solicitation for a transaction in any financial instrument and thus should not be treated as such. The information provided does not involve any specific investment objectives, financial situation and needs of any specific person who may receive it. Please be aware, that past performance is not a reliable indicator of future performance and/or results. Past Performance or Forward-looking scenarios based upon the reasonable beliefs of the third-party provider are not a guarantee of future performance. Actual results may differ materially from those anticipated in forward-looking or past performance statements. IC Markets makes no representation or warranty and assumes no liability as to the accuracy or completeness of the information provided, nor any loss arising from any investment based on a recommendation, forecast or any information supplied by any third-party.
AUDCAD Resistance Ahead!
HI,Traders !
#AUDCAD is trading in an
Uptrend but the pair is locally
Overbought so after the pair
Hits the horizontal resistance
Level of 0.90210 we will be
Expecting a local bearish
Move down !
Comment and subscribe to help us grow !

AUDCAD – DAILY FORECAST Q3 | W31 | D30 | Y25
📊 AUDCAD – DAILY FORECAST
Q3 | W31 | D30 | Y25
Daily Forecast 🔍📅
Here’s a short diagnosis of the current chart setup 🧠📈
Higher time frame order blocks have been identified — these are our patient points of interest 🎯🧭.
It’s crucial to wait for a confirmed break of structure 🧱✅ before forming a directional bias.
This keeps us disciplined and aligned with what price action is truly telling us.
📈 Risk Management Protocols
🔑 Core principles:
Max 1% risk per trade
Only execute at pre-identified levels
Use alerts, not emotion
Stick to your RR plan — minimum 1:2
🧠 You’re not paid for how many trades you take, you’re paid for how well you manage risk.
🧠 Weekly FRGNT Insight
"Trade what the market gives, not what your ego wants."
Stay mechanical. Stay focused. Let the probabilities work.
FX:AUDCAD

AUDCAD: Long Trade Explained
AUDCAD
- Classic bullish formation
- Our team expects pullback
SUGGESTED TRADE:
Swing Trade
Long AUDCAD
Entry - 0.8914
Sl - 0.8901
Tp - 0.8941
Our Risk - 1%
Start protection of your profits from lower levels
Disclosure: I am part of Trade Nation's Influencer program and receive a monthly fee for using their TradingView charts in my analysis.
❤️ Please, support our work with like & comment! ❤️

AUDCAD I Daily CLS I Model 2 I HTF DOL TargetYo Market Warriors ⚔️
Fresh Crypto Analysis— if you’ve been riding with me, you already know:
🎯My system is 100% mechanical. No emotions. No trend lines. No subjective guessing. Working all timeframes. Just precision, structure, and sniper entries.
🧠 What’s CLS?
It’s the real smart money. The invisible hand behind $7T/day — banks, algos, central players.
📍Model 1:
HTF bias based on the daily and weekly candles closes,
Wait for CLS candle to be created and manipulated. Switch to correct LTF and spot CIOD. Enter and target 50% of the CLS candle.
For high probability include Dealing Ranges, Weekly Profiles and CLS Timing.
Analysis done on the Tradenation Charts
Disclosure: I am part of Trade Nation's Influencer program and receive a monthly fee for using their TradingView charts in my analysis.
Trading is like a sport. If you consistently practice you can learn it.
“Adapt what is useful. Reject whats useless and add whats is specifically yours.”
David Perk aka Dave FX Hunter
💬 Comment any Coin I ll give you my quick view

AUDCAD4HR:
The price broke down from a double parallel channel, forming a lower low, which confirms a bearish bias. It then pulled back to retest the broken channel and resistance, where a long-wick candle rejection occurred.
This rejection also aligned with multiple previous Points of Control (POC), adding confluence.
Afterward, a shift from bullish to bearish was confirmed on the 15-minute timeframe.
A clean 1:2 risk-reward trade setup followed.
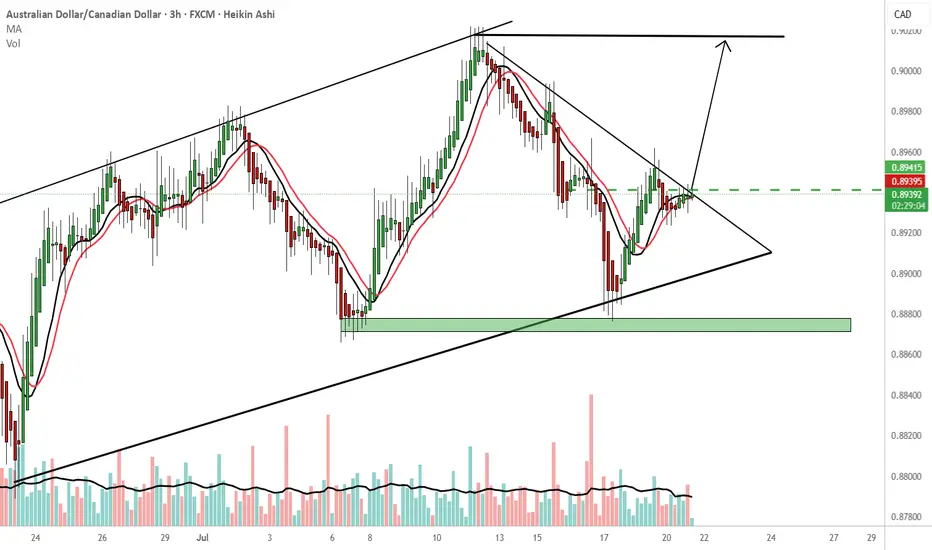
AUDCAD: Bullish Move From Trend Line 🇦🇺🇨🇦
AUDCAD may bounce from a solid rising trend line on a 4H.
The price started to consolidate on that after its test.
A breakout of a minor horizontal resistance is a strong bullish confirmation.
Goal - 0.8999
❤️Please, support my work with like, thank you!❤️
I am part of Trade Nation's Influencer program and receive a monthly fee for using their TradingView charts in my analysis.

audcadAUD/CAD Trade Signal – Strategic Short Opportunity Identified
A compelling short-selling opportunity has materialized on the AUD/CAD currency pair, presenting traders with a potential low-risk, high-reward setup. The pair is currently trading near a key resistance level, showing signs of bearish exhaustion and potential reversal. Market participants are encouraged to consider initiating a short position around the entry price of 0.89929, where the pair appears overextended and vulnerable to downside pressure.
Trade Execution Parameters:
Entry Point: 0.89929 – This level is aligned with short-term resistance and represents a favorable risk-to-reward entry for sellers.
Take-Profit Objectives:
🎯 Target 1: 0.89888 – Initial support level, ideal for partial profit-taking.
🎯 Target 2: 0.89880 – Deeper retracement, suggesting increased bearish momentum.
🎯 Target 3: 0.89875 – Final target, near the lower boundary of current intraday range.
Stop Loss: 0.89980 – Placed slightly above the resistance area to contain losses in case of an unexpected breakout to the upside.
AUD/CAD SELLERS WILL DOMINATE THE MARKET|SHORT
Hello, Friends!
We are now examining the AUD/CAD pair and we can see that the pair is going up locally while also being in a uptrend on the 1W TF. But there is also a powerful signal from the BB upper band being nearby, indicating that the pair is overbought so we can go short from the resistance line above and a target at 0.885 level.
Disclosure: I am part of Trade Nation's Influencer program and receive a monthly fee for using their TradingView charts in my analysis.
✅LIKE AND COMMENT MY IDEAS✅

AUDCAD – DAILY FORECAST Q3 | W31 | D28 | Y25📊 AUDCAD – DAILY FORECAST
Q3 | W31 | D28 | Y25
Daily Forecast 🔍📅
Here’s a short diagnosis of the current chart setup 🧠📈
Higher time frame order blocks have been identified — these are our patient points of interest 🎯🧭.
It’s crucial to wait for a confirmed break of structure 🧱✅ before forming a directional bias.
This keeps us disciplined and aligned with what price action is truly telling us.
📈 Risk Management Protocols
🔑 Core principles:
Max 1% risk per trade
Only execute at pre-identified levels
Use alerts, not emotion
Stick to your RR plan — minimum 1:2
🧠 You’re not paid for how many trades you take, you’re paid for how well you manage risk.
🧠 Weekly FRGNT Insight
"Trade what the market gives, not what your ego wants."
Stay mechanical. Stay focused. Let the probabilities work.
FX:AUDCAD

AUDCAD – WEEKLY FORECAST Q3 | W31 | Y25📊 AUDCAD – WEEKLY FORECAST
Q3 | W30 | Y25
Weekly Forecast 🔍📅
Here’s a short diagnosis of the current chart setup 🧠📈
Higher time frame order blocks have been identified — these are our patient points of interest 🎯🧭.
It’s crucial to wait for a confirmed break of structure 🧱✅ before forming a directional bias.
This keeps us disciplined and aligned with what price action is truly telling us.
📈 Risk Management Protocols
🔑 Core principles:
Max 1% risk per trade
Only execute at pre-identified levels
Use alerts, not emotion
Stick to your RR plan — minimum 1:2
🧠 You’re not paid for how many trades you take, you’re paid for how well you manage risk.
🧠 Weekly FRGNT Insight
"Trade what the market gives, not what your ego wants."
Stay mechanical. Stay focused. Let the probabilities work.
FX:AUDCAD

AUDCAD TRADE IDEA AUDCAD has given us a pullback to our Fibonacci level and has flown to the moon...
Let's see if the market does it's thing and gets to our desired target
AUDCAD BULLS Looking for buys, consider the following confirmation.
-Inverse Head and Shoulder formation, you can consider buys above the green broken line, you could wait for a retest @ 0.89420 before liftoff.
-Consider 0.90200 as the first TP
-TP 2: 0.91200
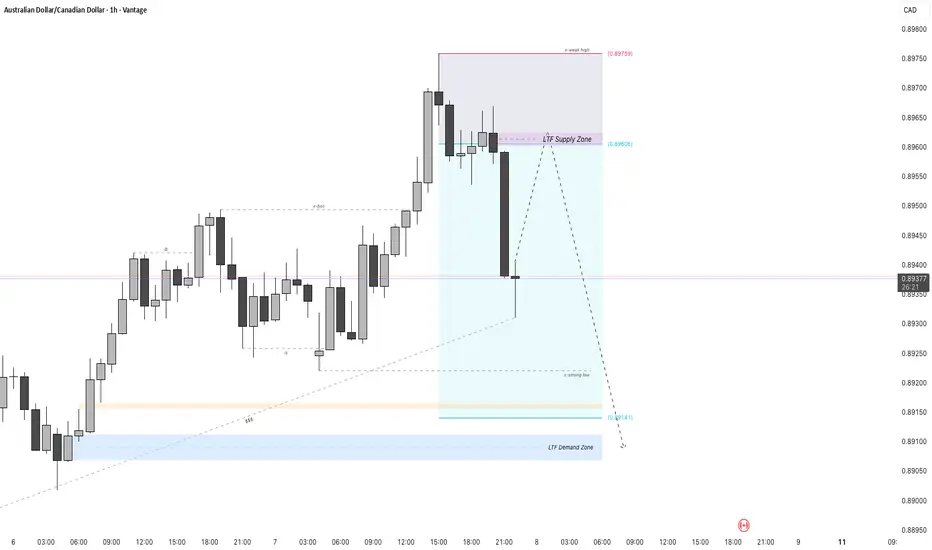
AUDCAD - 1H Chart Using Smart Money ConceptsThis trading plan follows the Smart Money Concept (SMC) methodology, emphasizing institutional price behavior to anticipate potential market moves.
Market Context:
The price recently experienced a strong bearish move from a Higher Time Frame (HTF) Supply Zone around 0.8960, leading to a sharp decline. The current price is at a potential support area near a previous Order Block located around 0.8940.
Major Zones:
LTF Supply Zone (0.8960 region): This is a significant resistance area where institutional sellers previously entered, causing the strong downward move. A retest of this zone could provide a high-probability short setup if price rallies back here.
LTF Demand Zone (around 0.8914): This is a strong support area indicated by the chart that may act as a buyer accumulation zone.
Price Action & Structure:
The chart shows key Smart Money Concept structures including:
Order Blocks (OB): Areas where institutions likely placed orders before strong price moves.
Break of Structure (BOS): Recent bearish structure break confirms a shift in momentum downward.
Trading Bias and Plan:
The plan considers a bearish continuation bias after a potential retracement.
Traders should watch for price to retrace up towards the LTF Supply Zone (the identified resistance zone) before entering short positions. This retracement offers an opportunity to enter with better risk to reward near institutional selling areas.
Confirmation signals like rejection candles or liquidity tests at the supply zone enhance the setup validity.
If the supply zone fails to hold and price breaks higher, the scenario invalidates and traders should reassess.
Targets and Risk Management:
Initial targets can be set near the LTF Demand Zone and further below near strong lows identified on the chart.
Protective stop losses should be placed above the supply zone or above recent swing highs to minimize risk from false breakouts.
AUDCAD high probability short Like AUDUSD i called, we have been over extended on the oscillators for many candles, we have also pulled way from the VWAP for an extended distance and time period. we are going to put SL above most relevant high and shoot for VWAP as TP. I would layer multiple trades once per candle or twice per candle until we hit Sl or start the roll over into profit. Low risk per trade, max trade 7

AUDCAD Long Position levels
A long position is initiated on AUDCAD following a significant bullish breakout from a multi-day consolidation. This idea outlines a two-tiered take-profit strategy, targeting key psychological and structural resistance levels, while managing risk with a defined stop loss.
Entry: 0.89560
Take Profit 1: 0.9001
Take Profit 2: 0.91560
Stop Loss: 0.88808
Current Status & Outlook: The price is currently trading just above the potential entry point. The trade is based on the expectation of a sustained upward move after the recent breakout, with a clear strategy for taking profits and managing risk.
Disclaimer
This analysis is for educational and informational purposes only and does not constitute financial advice. The provided trade idea is based on technical analysis and historical price action, and past performance is not indicative of future results. Trading foreign exchange on margin carries a high level of risk and may not be suitable for all investors. Before deciding to trade, you should carefully consider your investment objectives, level of experience, and risk appetite. You could lose some or all of your initial investment. Seek advice from an independent financial advisor if you have any doubts. Any action you take upon the information on this chart and analysis is strictly at your own risk.
