AUDCAD Buy Opportunity Based on EASY Trading AI SignalAUDCAD has just triggered a promising BUY signal from the EASY Trading AI model. Entering at 0.85218, our system projects growth towards the Take Profit target at 0.86586. The Stop Loss recommended by EASY Trading AI is set safely at 0.84197.This bullish scenario aligns with recent AUD strength due to stable commodities and improving economic data from Australia. Simultaneously, weakening oil prices are impacting CAD negatively, enhancing upward momentum for AUDCAD.Closely monitor price to ensure adherence to EASY Trading AI guidelines, capitalizing effectively on clear market signals presented.
AUDCAD trade ideas

AUDCAD: True Bullish Reversal?! 🇦🇺🇨🇦
AUDCAD formed a nice inverted head and shoulders pattern
after a test of a key historic support.
A bullish violation of its neckline with a strong bullish candle
provides a reliable confirmation.
I expect a correctional move at least to 0.8723
❤️Please, support my work with like, thank you!❤️

AUD/CAD For Bullishyou can go long now
or
wait for pull-back near by entry point and then go long
current phase is pull-back and may be finish near target 3
have fun :)

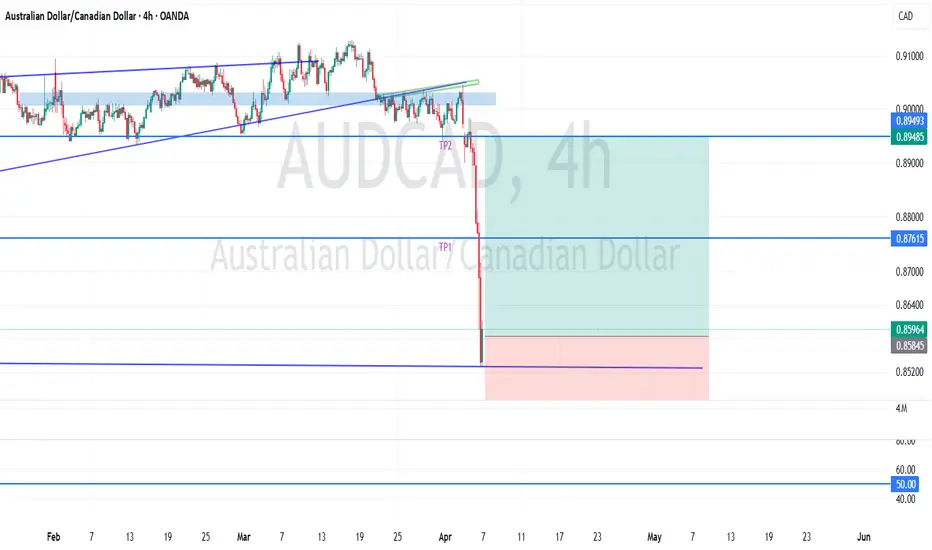
AUD/CAD is showing Bullish Divergence on 1 hour time frameThe Forex pair AUD/CAD is showing bullish divergence on 1 hour time frame. The possible entry and SL, with TP1 and TP2 are given on the chart

AUDCAD Discretionary Analysis: Next stop? Rock bottomIt’s more of a sixth sense (like when you just know your girlfriend's about to cancel plans). AUDCAD’s giving off that "Next stop? Rock bottom" kind of energy. I see it dropping hard, like it missed the elevator and took the shaft instead. If I’m right, I’ll be looking at some solid trades to take. If I’m wrong, well, I’ll just grab a coffee and wait for the next pair to make its move.
Just my opinion, not financial advice.

AUD/CAD Weekly AnalysisWe can see a huge weekly candle (circa 500 pips) as sellers took price all the way down to sub 0.8600 last week.
Looking back over the years, 0.8600 has been a huge demand zone for this pair.
This may now lead to opportunities to buy on the smaller time frames.
This is just an idea of what may happen. You should always trade with a well tested and profitable trading strategy using good risk management.

AUD/CAD on the 1-hour timeframe AUD/CAD on the 1-hour timeframe, and here's a detailed analysis based on the current price action and key levels:
🔍 Market Structure & Price Action
The overall trend prior to the recent move is bearish, as shown by the consistent series of lower highs and lower lows.
Price dropped sharply, breaking through previous support levels, and has now tapped into a demand zone (support area) around 0.85500.
After touching this demand zone, bullish rejection wicks appeared, indicating buying interest and potential exhaustion of selling momentum.
🧱 Key Levels
Support Zone (Demand Area):
Around 0.85400 - 0.85600 (shaded in pink at the bottom). This area has held, showing buyers stepping in.
Resistance Zone (Supply Area):
Around 0.88400 - 0.88600 (shaded in pink at the top), which is a previous support turned resistance.
🔁 Possible Scenario (As Indicated by the Chart)
The red arrow shows a potential bullish reversal:
Price might make a small pullback or retest of the demand zone.
If it forms a higher low and confirms bullish intent, a move toward the 0.88400-0.88600 resistance zone is likely.
📈 Bullish Confirmation Needed
To confirm a buy setup, look for:
A break above recent minor resistance (near 0.86200 - 0.86400).
Strong bullish candles or a bullish engulfing pattern.
Potential confluence with indicators (e.g., RSI divergence, EMA crossover, etc.).
🚫 Bearish Risk
If price breaks below the demand zone (0.85400), the bearish trend may continue, invalidating the reversal setup.
In such a case, next support might be much lower, and short opportunities could arise.
✅ Summary
Bias: Potential short-term bullish reversal within a broader bearish trend.
Entry Consideration: After a higher low or bullish confirmation near 0.85600–0.86000.
Target: Resistance zone at 0.88400–0.88600.
Invalidation: Break below 0.85400.

AUDCAD at major support.After a terrific fall of AUD we can see a major support in long term trend. So I'm expecting the price to turn bullish very soon. Please share your opinion in comments.
Note: Not a financial advice

AUDCAD Next StepsThe upside correction I pointed out in my previous analysis finished (a little earlier than I expected), and there was a strong downside movement after Trump´s tariffs announcement.
Next steps for price are:
1) 100% extension at 0.83916.
2) Strong supply zone (gray area) between 0.80 and 0.83.
Until price reaches these levels, upside corrections are shorting opportunities.

Recent Trades Just MadeI have just entered several short positions on AUD/CAD. The reason for making those trades was that the exchange rate was well below SMA(200), which was sloping downwards in the H1 timeframe. Moreover, lower lows had been created. As a result of my analyses, I made more than USD 35 from my mini-account, equivalent to a return of more than 40%!

#AUDCAD: Using 1-Day Time Frame For Intraday Entry! We have been closely monitoring the AUDCAD currency pair for an extended period and believe that selling AUDCAD at the current market conditions presents a more favourable opportunity with a sufficient number of sellers. However, we must acknowledge that we need to wait for the price to approach our entry zone, which will allow us to execute a sell entry with strict risk management. This analysis has identified a single target.
We extend our best wishes for your success and encourage you to provide support by liking and commenting on the idea.
Team Setupsfx_

AUD/CAD BUYERS WILL DOMINATE THE MARKET|LONG
AUD/CAD SIGNAL
Trade Direction: long
Entry Level: 0.880
Target Level: 0.889
Stop Loss: 0.874
RISK PROFILE
Risk level: medium
Suggested risk: 1%
Timeframe: 1h
Disclosure: I am part of Trade Nation's Influencer program and receive a monthly fee for using their TradingView charts in my analysis.
✅LIKE AND COMMENT MY IDEAS✅

AUDCAD LongWe have a gap which we seek to fill with this trade. We join the trade at 0.89280 which we shall go till 0.89700

AUDCAD Discretionary Analysis: Taking the Elevator DownIt’s more of a sixth sense(like when you just know the milk is bad before you smell it). I think it’s headed down, like an elevator with a broken cable . If I’m right, I’ll make some money. If I’m wrong, well… guess I’ll take the stairs next time.
Just my opinion, not financial advice.

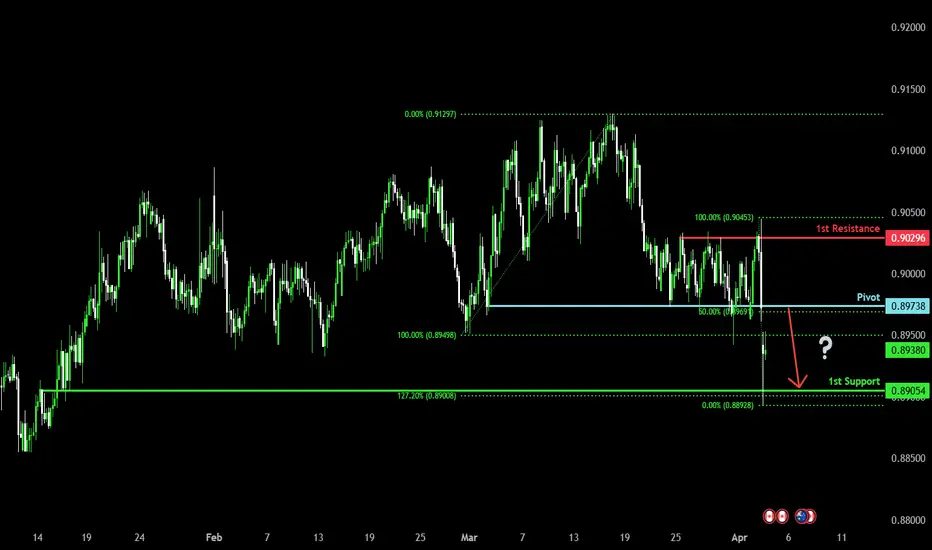
Bearish reversalAUD/CAD is rising towards the pivot which is a pullback resistance and could reverse to the 1st support which line sup with the 127.2% Fibonacci extension.
Pivot: 0.89738
1st Support: 0.89054
1st Resistance: 0.90296
Risk Warning:
Trading Forex and CFDs carries a high level of risk to your capital and you should only trade with money you can afford to lose. Trading Forex and CFDs may not be suitable for all investors, so please ensure that you fully understand the risks involved and seek independent advice if necessary.
Disclaimer:
The above opinions given constitute general market commentary, and do not constitute the opinion or advice of IC Markets or any form of personal or investment advice.
Any opinions, news, research, analyses, prices, other information, or links to third-party sites contained on this website are provided on an "as-is" basis, are intended only to be informative, is not an advice nor a recommendation, nor research, or a record of our trading prices, or an offer of, or solicitation for a transaction in any financial instrument and thus should not be treated as such. The information provided does not involve any specific investment objectives, financial situation and needs of any specific person who may receive it. Please be aware, that past performance is not a reliable indicator of future performance and/or results. Past Performance or Forward-looking scenarios based upon the reasonable beliefs of the third-party provider are not a guarantee of future performance. Actual results may differ materially from those anticipated in forward-looking or past performance statements. IC Markets makes no representation or warranty and assumes no liability as to the accuracy or completeness of the information provided, nor any loss arising from any investment based on a recommendation, forecast or any information supplied by any third-party.
AUDCAD ; BULLISH REVERSAL CONFIRMEDAUDCAD; may continue to sell this is after it breaks through the trendline
There a strong support zone around 1.89400
The price may pull back to the previous highs
Daily/H1/M15 , They all show buy confirmation

AUDCAD LONG/BUYBy utilizing Fibonacci retracement levels, historical patterns, , we can formulate a hypothesis that the market might follow a similar trajectory if bearish sentiment prevails.

AUD-CAD Will Go Down! Sell!
Hello,Traders!
AUD-CAD shot up sharply
But then horizontal resistance
Of 0.9035 and we are already
Seeing a bearish reaction so
We will be expecting a
Further move down
Sell!
Comment and subscribe to help us grow!
Check out other forecasts below too!
Disclosure: I am part of Trade Nation's Influencer program and receive a monthly fee for using their TradingView charts in my analysis.

AUD/CAD For Bullishyou can go long now
or
wait for pull-back near by entry point and then go long
general trend is up trend
have fun :)

AUDCAD FORECASTToday guys we have AUDCAD on watch and it is looking good as we are waiting for the lower timeframe confirmation to see if we can take that trade as an insurance entry. However we haven't to rush this, let's wait the market to come to our side before we capitalize on it!

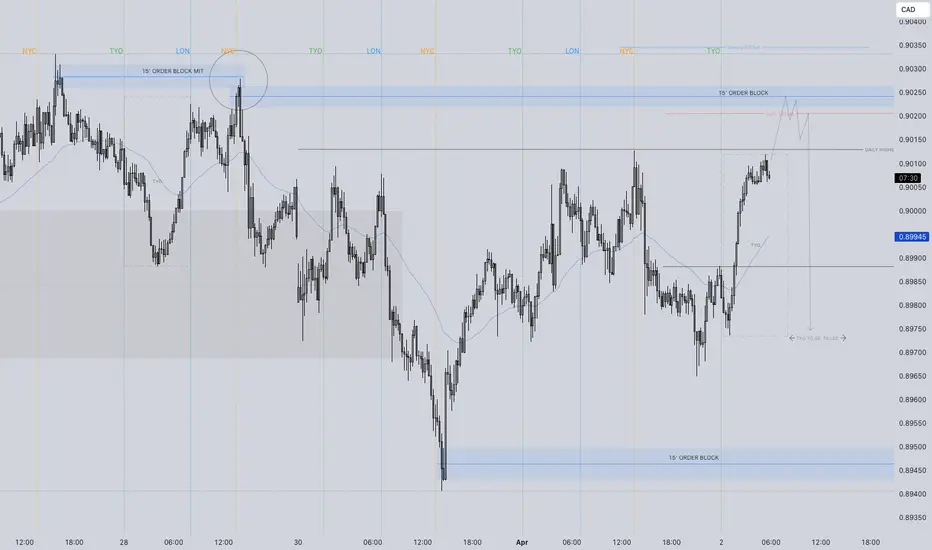
AUDCAD SHORT Q2 W14 Y25 WED 2ND APRIL 2025AUDCAD SHORT Q2 W14 Y25 WED 2ND APRIL 2025
All the ingredients for a high probability short position. Weekly & daily 50 Exponential moving averages coming to join the short party. Higher time frame, namely the weekly time frame currently range with EMA beautifully in the middle of price action. That leaves from a deeper look into the lower time frames to see where the higher time frame EMA's line up.
I'll keep it snappy, what I require is price NOT to touch the Tokyo lows. This is added into the bag of FRGNT confluences. Price needs to trickle into the 15' just above the current Tokyo session. I need lower time frame breaks of structure to form post London open. A lower time frame order block to be created to short from. 5' Break of structure is what is I'd like to see.
Short and snappy short synopsis. I hope the photo paints the narrative better than I can explain it.
FRGNT X
AUDCAD Technical AnalysisOur analysis is based on multi-timeframe top-down analysis & fundamental analysis.
Based on our view the price will fall to the monthly level.
DISCLAIMER: This analysis can change anytime without notice and is only for assisting traders in making independent investment decisions. Please note that this is a prediction, and I have no reason to act on it, and neither should you.
Please support our analysis with a like or comment!
Let’s master the market together. Please share your thoughts and encourage us to do more by liking this idea.
