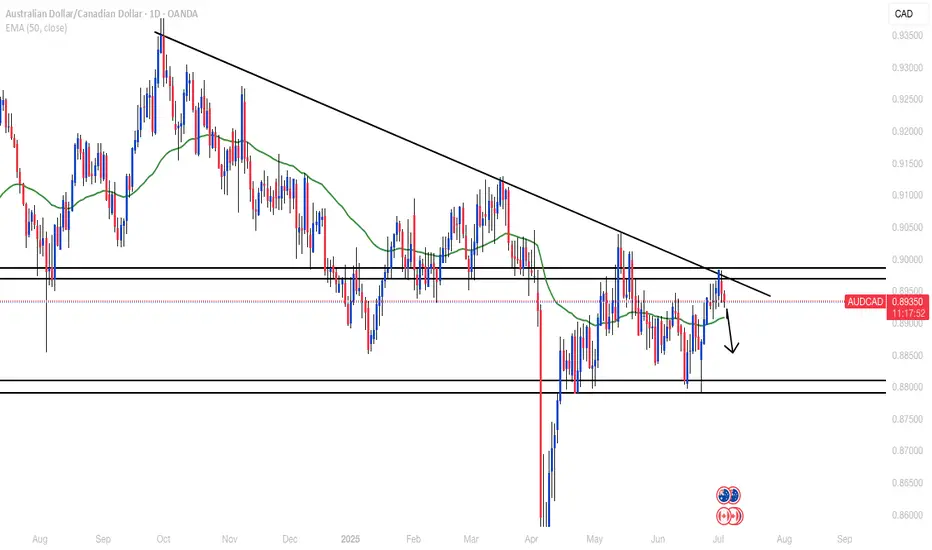
AUDCAD (Daily Timeframe) shows a symmetrical triangleAUDCAD has reached the resistance line of symmetrical upper trend line and price got rejected from here and may likely to go the support trend line. 4 hr chart makes it more clear.
AUDCAD trade ideas

AUDCAD – Bearish Setup Following Retracement to Key ResistanceWelcome to Velatrix Capital.
Below is a live market opportunity identified by our internal trading desk.
This is not financial advice. It’s a data-backed, logic-driven trading edge. Use it with discipline — or don’t use it at all.
🧠 Technical Outlook
AUDCAD is currently showing bullish momentum on the lower timeframes, approaching a key resistance zone between 0.89057 – 0.89272.
Our trading desk expects price to reach this supply zone and then present a short-selling opportunity with favorable risk/reward potential.
We advise waiting patiently for the price to enter this key range before initiating any short trades.
Trade Parameters:
• Timeframe: 1H
• Direction: Sell
• Entry Zone: 0.89272 – 0.89057
• Stop Loss (SL): 0.89386
• Take Profit 1 (TP1): 0.88458
• Take Profit 2 (TP2): 0.87954
• Risk/Reward (R/R): 1:2 / 1:4.80
Note: Setup is invalidated if price breaks and closes above 0.89386.
🔔 Follow Us
This is just the surface.
For more setups, clean breakdowns, and performance-driven content:
📌 Follow, engage, and stay sharp. Our edge is real — and it’s public.
We don’t chase hype. We build edge.

07.07.25 Morning ForecastPairs on Watch -
FX:AUDCAD
FX:USDJPY
FX:EURUSD
A short overview of the instruments I am looking at for today, multi-timeframe analysis down to what I will be looking at for an entry. Enjoy!

I'm selling AUDCAD.🧨 AUD looks strong — but I'm selling AUDCAD.
China’s bounce and risk-on vibes gave AUD a lift, but it’s shaky under the hood.
🇨🇦 CAD’s weak, sure — but it’s already priced in, and oil could surprise.
I’m short AUDCAD — fading the hype before the cracks show.
📉 Price is high, conviction is higher.
Would you take this trade?

AUDCAD SELL projection AUDCAD Closer Look, We need to witness Some sell Pressure on AUDCAD from a Daily/4H timeframe look.
We have a support level at 0.88997 tested severally in recent times.
By Next week the 0.88997 Support will be broken to the downside. which will open AUDCAD to further Sell down to 0.87347 - 0.86665 Support Levels

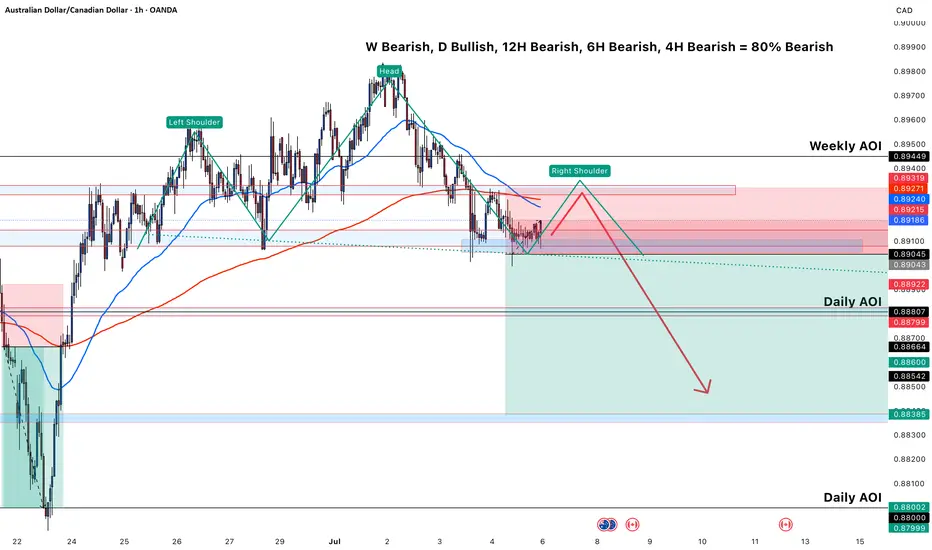
AUD/CAD chart shows a **clear bearish bias**This AUD/CAD chart shows a **clear bearish bias** supported by multiple timeframes and a head and shoulders pattern forming, which justifies a potential **sell setup**. Here's a breakdown of the reasoning:
---
### 🧠 **Multi-Timeframe Analysis Bias**
* **Weekly: Bearish**
* **Daily: Bullish**
* **12H, 6H, 4H: Bearish**
* ✅ Overall: **80% Bearish Bias**
This gives confidence that **lower timeframes** are aligning to favor a **short trade**.
---
### 🧱 **Technical Structure – Head & Shoulders**
* **Left Shoulder**, **Head**, and **Right Shoulder** are identified.
* The **Right Shoulder is projected to complete** near the **Weekly Area of Interest (AOI)**.
* This structure is a **classic bearish reversal pattern**, suggesting a potential breakdown after the right shoulder forms.
---
### 📍 **Key Zones**
* **Weekly AOI (0.89271–0.89449)**: Strong supply zone; potential area for **price rejection**.
* **Daily AOI (0.88002–0.88709)**: Key downside target, aligning with prior demand zones.
---
### 🧰 **Indicators and Confluences**
* **Price is below the 50 EMA and testing the 200 EMA**, indicating weakening bullish momentum.
* Bearish price action is forming near resistance.
* Entry is planned after the right shoulder forms, respecting structure.
---
### 🧨 **Sell Trade Idea Summary**
* **Sell after the right shoulder completes around 0.892–0.894**
* **Target**: Daily AOI (especially near 0.8800–0.8838)
* **Stop Loss**: Above the head (likely above 0.8950)
* **Risk/Reward**: Appears favorable (>2:1 based on projection)
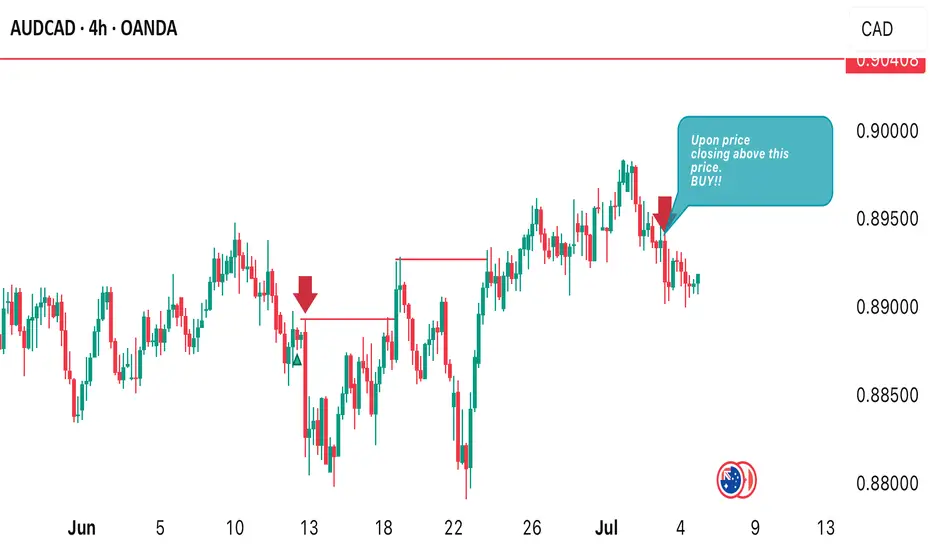
AUDCAD INTRADAY TIMEFRAME IS QUITE BULLISHPrice has completely shifted from intraday bearish to bullish. I anticipate more. Bullish price action to develop in later days of coming week. I am positioning myself for a buy opportunity. Once I see price close above 0.89413 I’m going long!
AUDCAD BUYBy utilizing Fibonacci retracement levels, historical patterns, , we can formulate a hypothesis that the market might follow a similar trajectory if bullish sentiment prevails.

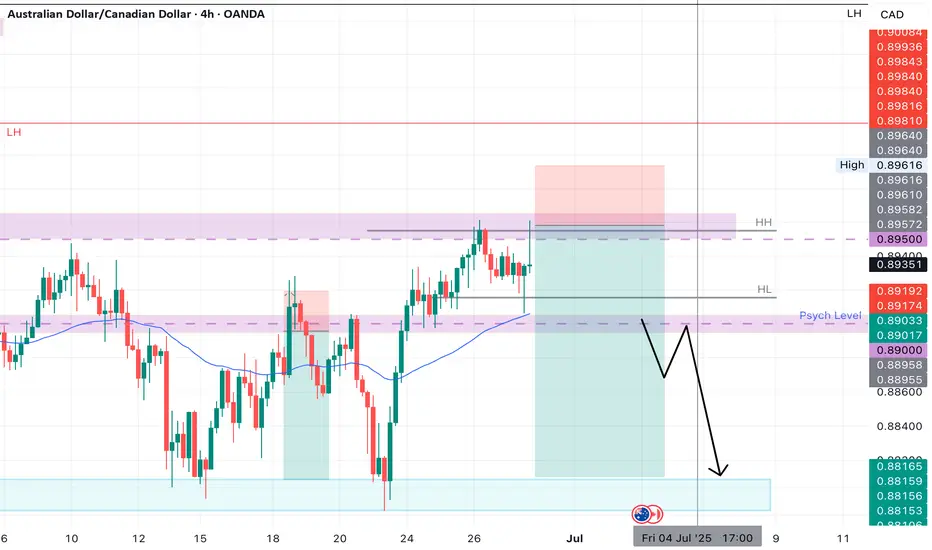
AUDCAD SHORT Market structure bearish on HTFs DW
Entry at both Daily and Weekly AOi
Weekly Rejection At AOi
Previous Weekly Structure Point
Weekly EMA retest
Daily Rejection at AOi
Previous Structure point Daily
Around Psychological Level 0.89500
H4 Candlestick rejection Y
Levels 4,17
Entry 95%
REMEMBER : Trading is a Game Of Probability
: Manage Your Risk
: Be Patient
: Every Moment Is Unique
: Rinse, Wash, Repeat!
: Christ is King.
AUDCADRejecting off the daily resistance zone and trendline. Waiting for break below H4/H1 support, retest then look for selling signals
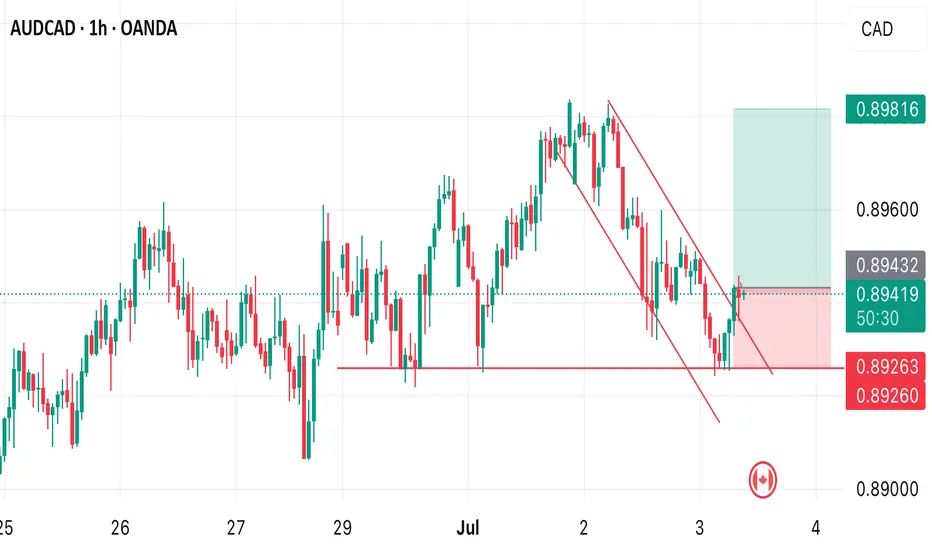
AUDCAD BUY OPPORTUNITY Price just broke out of the descending channel. We’re going to see more bullish price action development away from the current market price. Target profit is at 0.89816
AUDCAD: Bearish Continuation & Short Trade
AUDCAD
- Classic bearish formation
- Our team expects pullback
SUGGESTED TRADE:
Swing Trade
Short AUDCAD
Entry - 0.8947
Sl - 0.8974
Tp - 0.8903
Our Risk - 1%
Start protection of your profits from lower levels
Disclosure: I am part of Trade Nation's Influencer program and receive a monthly fee for using their TradingView charts in my analysis.
❤️ Please, support our work with like & comment! ❤️

AUD Cad Short waiting for the price to hit my area of resistance. pull back to entry point to confirm a bear trend .

AUD/CAD – Bullish Continuation with Fibonacci-Based Entry -1H-TFWe're closely monitoring AUD/CAD on the 1-hour chart, where the pair is maintaining a strong bullish trend, consistently forming higher highs (HH) and higher lows (HL).
Currently, the price is undergoing a retracement, and a new HL appears to be forming. Using the Fibonacci retracement tool, we observed a pullback beyond the 0.5 level, which aligns with a high-probability entry zone for trend continuation setups.
Based on this technical alignment, we’ve executed an instant buy order, aiming to capitalize on the next potential leg upward.
🔹 Pair: AUD/CAD
🔹 Timeframe: 1H
🔹 Trend: Bullish
🔹 Divergence: None
🔹 Pattern: None
🔹 Harmonic: None
🔹 Sentiment: N/A
🔹 Bias: Bullish
🔹 Entry (Instant Buy): 0.89537
🔹 Stop Loss: 0.89238
🔹 Take Profit 1: 0.89812
🔹 Lot Size: 0.92
🔹 Risk/Reward: 1:1
🔹 Risk: $200
🔹 Potential Reward: $200
🎯 Strategy: Entry is based on a Fibonacci-based retracement after a series of bullish structure points (HH/HL). Setup is positioned for trend continuation with tight risk management.
📌 #AUDCAD #ForexSignals #TrendContinuation #FibonacciTrading #PriceAction #BullishTrend #SmartEntry #RiskManagement #1HChart #ForexTradeSetup #TechnicalAnalysis #BuySetup

AUDCAD Bullish week AUDCAD Bullish Confluence Analysis:
1. Daily Timeframe: Bullish daily candle closed after sweeping the previous day’s sell-side liquidity — indicating a strong rejection and potential shift in momentum.
2. 4H Structure: Price closed decisively above the key support/resistance level at 0.89300, confirming a break and potential continuation.
3. Daily Imbalance: A breakaway fair value gap (FVG) remains unfilled, with buyers showing strong intent by driving price higher — suggesting bullish pressure is still active.
4. Intraday Confirmation: Both 1H and 15M charts show breaker blocks and fair value gaps being filled, aligning with bullish targets and providing refined 15 min entry zone.

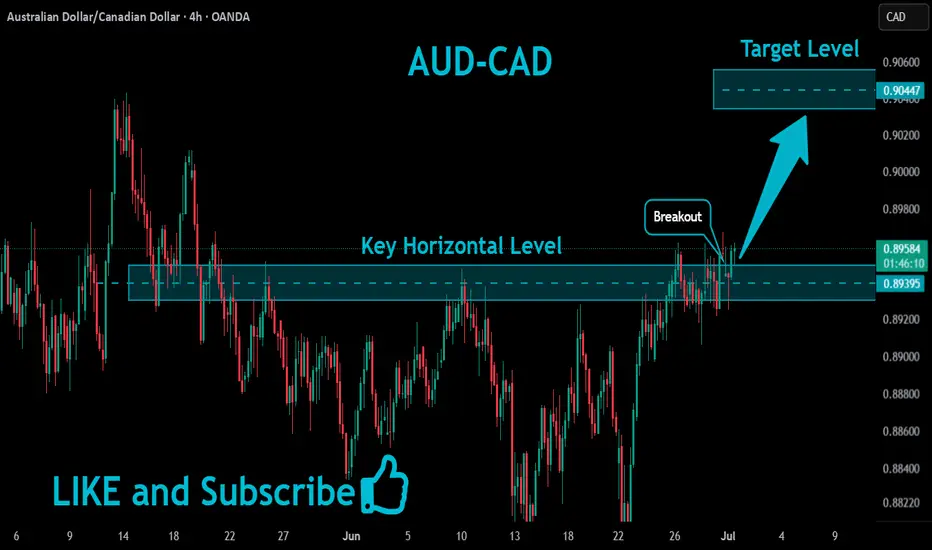
AUDCAD Strong Breakout!
HI,Traders !
#AUDCAD is trading in an
Uptrend and the pair has
Made a bullish breakout of
The key horizontal level
Of 0.89395 and the breakout
Is confirmed so we are
Bullish biased and we
Will be expecting a further
Bullish move up !
Comment and subscribe to help us grow !
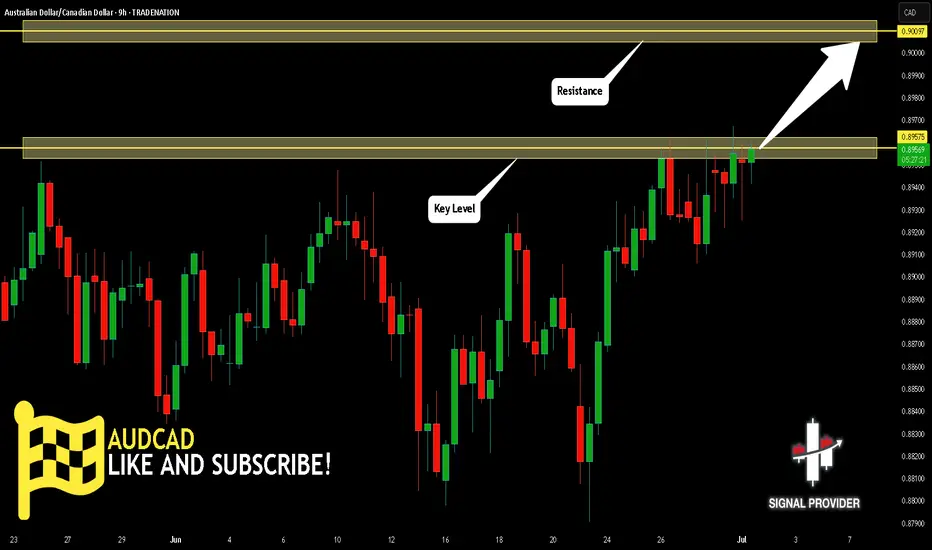
AUDCAD Is Going Up! Long!
Please, check our technical outlook for AUDCAD.
Time Frame: 9h
Current Trend: Bullish
Sentiment: Oversold (based on 7-period RSI)
Forecast: Bullish
The market is approaching a key horizontal level 0.895.
Considering the today's price action, probabilities will be high to see a movement to 0.900.
P.S
Please, note that an oversold/overbought condition can last for a long time, and therefore being oversold/overbought doesn't mean a price rally will come soon, or at all.
Disclosure: I am part of Trade Nation's Influencer program and receive a monthly fee for using their TradingView charts in my analysis.
Like and subscribe and comment my ideas if you enjoy them!
Bullish momentum to extend?AUD/CAD has bounced off the pivot and could potentially rise to the 1st resistance which lines up with the 161.8% Fibonacci extension.
Pivot: 0.8938
1st Support: 0.8905
1st Resistance: 0.9009
Risk Warning:
Trading Forex and CFDs carries a high level of risk to your capital and you should only trade with money you can afford to lose. Trading Forex and CFDs may not be suitable for all investors, so please ensure that you fully understand the risks involved and seek independent advice if necessary.
Disclaimer:
The above opinions given constitute general market commentary, and do not constitute the opinion or advice of IC Markets or any form of personal or investment advice.
Any opinions, news, research, analyses, prices, other information, or links to third-party sites contained on this website are provided on an "as-is" basis, are intended only to be informative, is not an advice nor a recommendation, nor research, or a record of our trading prices, or an offer of, or solicitation for a transaction in any financial instrument and thus should not be treated as such. The information provided does not involve any specific investment objectives, financial situation and needs of any specific person who may receive it. Please be aware, that past performance is not a reliable indicator of future performance and/or results. Past Performance or Forward-looking scenarios based upon the reasonable beliefs of the third-party provider are not a guarantee of future performance. Actual results may differ materially from those anticipated in forward-looking or past performance statements. IC Markets makes no representation or warranty and assumes no liability as to the accuracy or completeness of the information provided, nor any loss arising from any investment based on a recommendation, forecast or any information supplied by any third-party.

A bullish Trend in the AUDCAD pairI am taking my trade as chart showing clear divergence after bullish trend and pattern is sideways now but accepting to bearish.


AUDCAD Bulls update! Price is now approaching our first take profit (TP#1) at respected resistance level. I'm anticipating a small pullback from this area, followed by a potential continuation above the 0.89700 level.

AUDCAD: Short Trade with Entry/SL/TP
AUDCAD
- Classic bearish formation
- Our team expects fall
SUGGESTED TRADE:
Swing Trade
Sell AUDCAD
Entry Level - 0.8940
Sl - 0.8963
Tp - 0.8889
Our Risk - 1%
Start protection of your profits from lower levels
Disclosure: I am part of Trade Nation's Influencer program and receive a monthly fee for using their TradingView charts in my analysis.
❤️ Please, support our work with like & comment! ❤️

AUD/CAD BEST PLACE TO BUY FROM|LONG
Hello, Friends!
AUD-CAD downtrend evident from the last 1W red candle makes longs trades more risky, but the current set-up targeting 0.886 area still presents a good opportunity for us to buy the pair because the support line is nearby and the BB lower band is close which indicates the oversold state of the AUD/CAD pair.
Disclosure: I am part of Trade Nation's Influencer program and receive a monthly fee for using their TradingView charts in my analysis.
✅LIKE AND COMMENT MY IDEAS✅
