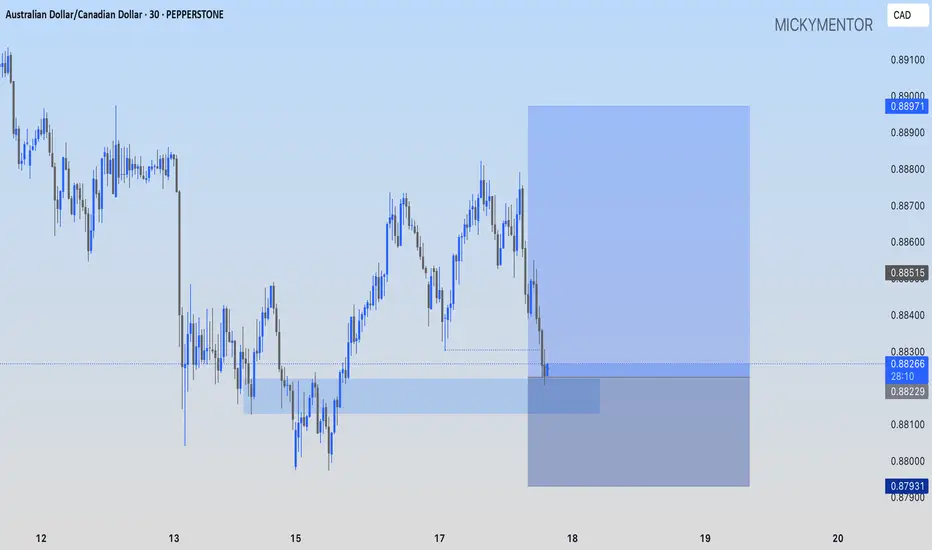
AUDCAD: A GOOD BUY OPPORTUNITY PEPPERSTONE:AUDCAD I'm going long at current market price, targeting 0.88971
AUDCAD trade ideas
AUDCAD SELL TRADE PLANAUD/CAD – 18 June 2025
📋 PLAN OVERVIEW
Parameter Details
Type Swing Short (Primary)
Direction 🔻 Short Bias
Status ⚠️ Watching for Rejection
R:R 1:2.5 (Base)
Confidence ⭐⭐⭐⭐ (84%) – HTF Trend Alignment
📈 MARKET BIAS & TRADE TYPE
AUD/CAD is respecting a broader D1 and H4 bearish trend, following a key breakdown and re-test structure. Price recently rejected from supply above 0.8865 and is now moving lower. The plan structure is based on continuation, with tactical pullbacks offering opportunity to join trend.
📌 Trade Type: Continuation
📌 Bias Origin: H4 BOS → Bearish OB Rejection
🔰 CONFIDENCE FACTORS
Component Weight Score
HTF Structure (D1/H4 BOS & OB) 35% ✅
Liquidity Logic (Sweep & Trap) 25% ✅
Macro Confluence 25% ⚠️ Moderate (CAD strength, AUD weakness)
Volume & Reaction Quality 15% ✅
Total Confluence Score: 84% ✅
📍 ENTRY ZONES (MAX 2)
Zone Range Type Confidence
🟧 Zone 0.8880–0.8895 D1 FVG/Inducement Zone ⭐⭐⭐
📌 Both zones are structurally aligned. Zone 2 sits slightly higher but is within macro value area.
📌 Price currently below both → Pending order logic applies.
❗ STOP LOSS LOGIC
* Zone 2 SL: Above 0.8905 (above HTF inducement & imbalance)
🎯 TAKE PROFIT LEVELS
TP Level Rationale
TP1 0.8815 Minor structure shelf / intraday reaction zone
TP2 0.8785 Liquidity void mid-range
TP3 0.8750 HTF trend continuation level (multi-day)
🧠 TRADE MANAGEMENT
* Entry 1/3 → Zone 1 rejection + H1 confirmation
* Entry 1/3 → Zone 2 (if triggered) with volume/sweep
* Move SL to BE after TP1
* Trail with fractals post-TP2
* Monitor for reverse CHoCH below 0.8790 to scale out early if invalidated
⚠️ CONFIRMATION CONDITIONS (MANDATORY)
* H1 or H4 bearish engulfing after zone tap ✅
* Session alignment: London or NY ✅
* Volume spike or wick rejection ✅
⏳ TRADE VALIDITY WINDOW
* Zone: Valid 48 hours
📌 If price breaks and closes above both → plan void
❌ INVALIDATION
* Break + close above 0.8905 = FULL PLAN INVALIDATED
* H1 BOS to upside after zone 2 = tactical failure
🌐 MACRO SNAPSHOT
* CAD strong on oil correlation
* AUD weak on risk-off tone
* DXY neutral – no disruption
📌 Macro supports downside but watch upcoming CAD CPI
📌 Plan is 100% structurally sound.
📌 Confirmation checklist MUST be met for execution.
📌 Market orders ONLY if confirmation prints after zone tap.

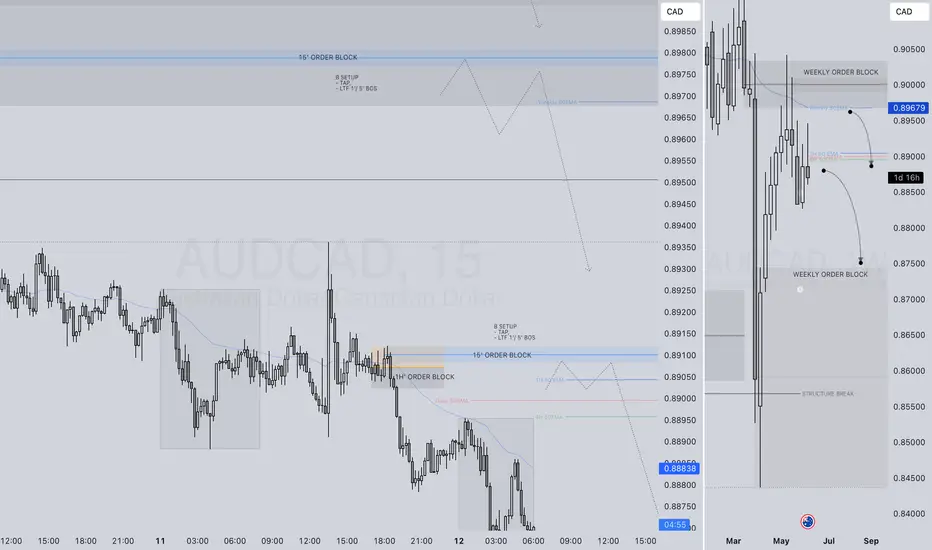
AUDCAD SHORT FORECAST Q2 W25 D18 Y25AUDCAD SHORT FORECAST Q2 W25 D18 Y25
Professional Risk Managers👋
Welcome back to another FRGNT chart update📈
Diving into some Forex setups using predominantly higher time frame order blocks alongside intraday confirmation breaks of structure.
💡Here are some trade confluences📝
✅Weekly 50 EMA
✅Weekly order block rejection
✅Daily order block rejection
✅15’ order block identification
🔑 Remember, to participate in trading comes always with a degree of risk, therefore as professional risk managers it remains vital that we stick to our risk management plan as well as our trading strategies.
📈The rest, we leave to the balance of probabilities.
💡Fail to plan. Plan to fail.
🏆It has always been that simple.
❤️Good luck with your trading journey, I shall see you at the very top.
🎯Trade consistent, FRGNT X

AUDCAD SELL SETUP IDEAI will be looking at shorting AUDCAD @0.89800000 area which is at the premium zone and also align with the trend. My stop loss will be @ the red horizontal line above and my take profit will be 3RR respectively. Apply proper risk management.

AUDCAD: Pullback From Resistance Confirmed 🇦🇺🇨🇦
AUDCAD is going to retrace from a key intraday horizontal resistance.
A local bearish CHoCH and an imbalance on an hourly time frame
provide a strong bearish confirmation.
Goal - 0.88445
❤️Please, support my work with like, thank you!❤️
I am part of Trade Nation's Influencer program and receive a monthly fee for using their TradingView charts in my analysis.

AUDCAD: Will Start Falling! Here is Why:
Looking at the chart of AUDCAD right now we are seeing some interesting price action on the lower timeframes. Thus a local move down seems to be quite likely.
Disclosure: I am part of Trade Nation's Influencer program and receive a monthly fee for using their TradingView charts in my analysis.
❤️ Please, support our work with like & comment! ❤️

AUDCAD: The Real Move Happens After the TrapNot every trade needs to be flashy.
This one was clean. Simple. Intentional.
And it came after most traders got taken out.
What I Saw :
Price swept PDL: textbook sell-side liquidity.
But instead of jumping in too early, I waited.
Why?
Because I’ve learned something:
👉 The first reaction is often just noise.
👉 The second one, the one that fills into structure. That’s where clarity lives.
My Entry Logic:
After the sweep, price broke minor structure. That was my Change of Character. I will just have to wait for price to pull into the FVG below 50% fibs retracement. Stop below the low. Target at the PDH.
Nothing fancy. Just discipline .
Psychology Check:
I’ve taken this setup before and watched it run without me. Why? Because I used to hesitate. I wanted more confirmation… or feared being wrong.
But here’s the truth:
Your edge is only real if you’re willing to take the shot when it appears .
This wasn’t a guess.
It was system + structure + emotional control.

AUD/CAD Short — Fundamentals Say “Down”
📉 **AUD/CAD Short — Fundamentals Say “Down”
The **Australian Dollar** is looking shaky:
* Business confidence is falling
* The RBA might **cut rates soon**
* And China (Australia’s top trade partner) is **slowing down**, which hurts demand for Aussie exports
Meanwhile, the **Canadian Dollar** is holding up better:
* Oil prices are steady — and oil is Canada’s strength
* Inflation is sticky, so the Bank of Canada is **more patient** with cuts
* Plus, Canada’s exports are still flowing strong
Put simply?
**Aussie is soft. Loonie is firm.**
This pair could slip lower — fundamentals favor **selling AUD/CAD**.
---

POSSIBLE SELL OPPORTUNITY ON AUDCADAUDCAD has been trending down confirmed by a 1-2-3 pattern. We see a ideal supply level formed here where we can take a sell trade!

AUDCAD - Medium term prediction - 16/06/25For AUD/CAD at 0.8811 here, I’d estimate roughly:
Rally above 0.9130 first ~35%
Drop below 0.8492 first ~65%
Why the skew toward the downside?
Recent rejection at 0.9130 – price failed there in late Feb/Mar and again in June, showing that ceiling still holds.
Lower‐high bias – since topping at 0.9130, each bounce has come in lower (now around 0.887 → 0.899 → 0.887), hinting at sellers stepping in earlier.
Momentum cooling – the last few daily candles are firm to the downside with little bullish follow‐through, suggesting a greater chance to test the bottom of the band before tagging the top.

AUDCAD trade ideea.The trend is bearish same as GBPCHF, head and shoulders panttern, now I am waiting for a retest of the neckline for me to enter the trade.


AUDCADRange Breakout: The pair has been trading within a range, and the breakout from this range signals potential bullish momentum. A breakout indicates that the price is ready to move out of its consolidation phase, with buyers now in control.
Trendline Breakout: The price breaking above a key trendline further confirms a shift from a bearish or neutral market sentiment to a more bullish one. This is a strong signal that upward momentum is building.

AUDCAD SHORT FORECAST Q2 W24 D13 Y25AUDCAD SHORT FORECAST Q2 W24 D13 Y25
Professional Risk Managers👋
Welcome back to another FRGNT chart update📈
Diving into some Forex setups using predominantly higher time frame order blocks alongside intraday confirmation breaks of structure.
💡Here are some trade confluences📝
✅Weekly 50 EMA
✅Weekly order block rejection
✅Daily order block rejection
✅15’ order block identification
🔑 Remember, to participate in trading comes always with a degree of risk, therefore as professional risk managers it remains vital that we stick to our risk management plan as well as our trading strategies.
📈The rest, we leave to the balance of probabilities.
💡Fail to plan. Plan to fail.
🏆It has always been that simple.
❤️Good luck with your trading journey, I shall see you at the very top.
🎯Trade consistent, FRGNT X

Why AUDCAD is On My Watchlist for a Short Trade🔎 AUDCAD Trade Idea Overview 🔎
Currently watching AUDCAD closely 👀 — and here’s what I’m seeing across the key timeframes:
📉 On the weekly timeframe, the pair remains in a clear bearish trend, with lower highs and lower lows forming consistently.
🕰️ Dropping down to the daily, we’re seeing continued bearish momentum in alignment with the higher timeframe bias.
⏳ On the 4-hour chart, there’s been a clean break of market structure, confirming short-term weakness.
🎯 I’m eyeing a pullback into equilibrium within the current price range for a potential short entry.
🔹 Entry: On retracement into a key value zone
🔹 Stop loss: Positioned above recent swing highs
🔹 Take profit: Targeting previous lows and liquidity pockets 💧
Patience is key here — waiting for the right setup to align across multiple timeframes. 📊
⚠️ Disclaimer: This is not financial advice. This analysis is for educational and informational purposes only. Always do your own research and manage risk responsibly. 💼


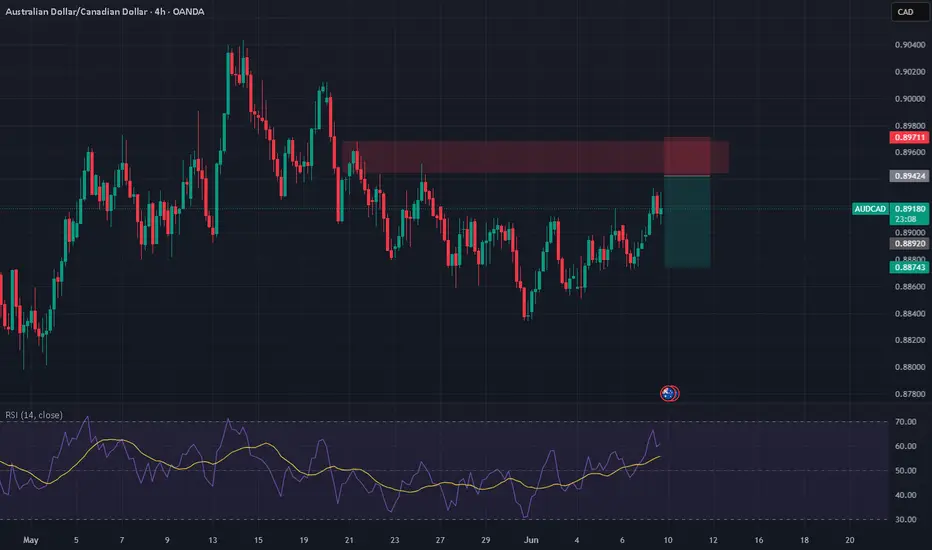
AUDCAD - Fundamentals vs Momentum – Betting on CAD🕓 Timeframe: 4H | ⚠️ Bias: Bearish From Supply Zone
AUDCAD is rejecting the 0.8940–0.8960 supply zone, a key resistance that's been respected multiple times. With RSI turning over near overbought and CAD fundamentals improving, this looks like a clean short opportunity.
📊 Technical Confluence
🔴 Resistance Zone: 0.8940–0.8960 (historical supply zone)
📉 Bearish Structure Intact: Still in a broader HTF downtrend (lower highs)
⚠️ RSI Divergence: Slowing near 62, suggesting momentum exhaustion
🕯️ Price Action: Current candle showing indecision – early signs of rejection
🌍 Fundamental Confluence
🇦🇺 AUD Weakness:
RBA paused rates, inflation easing → Dovish
AUD overextended after sentiment shift (conditional score ↑ too fast)
AUD vulnerable if sentiment shifts risk-off
🇨🇦 CAD Strength:
BoC holding firm on rates, hawkish tone
Oil production recovering → CAD-positive
COT net long position + seasonal strength
🎯 Trade Plan
📍 Entry: 0.8940–0.8955 (on bearish confirmation: engulfing/pin bar)
🛑 Stop Loss: 0.8975 (above resistance zone)
🎯 Take Profit 1: 0.8870 (mid-range)
🎯 Take Profit 2: 0.8830 (into demand zone)
⏱️ Optional: Partial entry now, scale in at 0.8960 if tapped
🧠 “Don’t chase the move. Sell the retest when momentum fades and fundamentals align.”
audcad buy tradeThe Relative Strength Index (RSI) is showing an upward trend, indicating increasing momentum. Additionally, the Moving Average Convergence Divergence (MACD) is showing a bullish crossover, further supporting the potential for an upward move.
AUDCAD SIMPLE TRENDLINE BREAK & RETEST!I just identified a simple trendline break and retest in H4 timeframe. In this trading strategy, it’s advisable to long AUDCAD as this will increase the probability of this asset making more bullish move. Therefore, a buy opportunity is envisaged from the current market price. Target is 0.9012

Lingrid | AUDCAD buying Opportunity at Channel Support BorderThe price perfectly fulfilled my last idea . OANDA:AUDCAD has pulled back sharply after forming a top at 0.8943 and is now approaching confluence support near the intersection of an upward trendline and horizontal zone around 0.8850. Price is showing early signs of stabilization, suggesting potential for a bullish reaction if the zone holds. A rebound from here could target the 0.8895 resistance level.
📈 Key Levels
Buy zone: 0.88500–0.88600
Buy trigger: bullish engulfing above 0.88650
Target: 0.88955
Sell trigger: break below 0.88260
💡 Risks
Loss of trendline support opens downside to 0.88260
Price may retest lower support before rebounding
Resistance near 0.8895 could cap recovery bounce
Traders, if you liked this idea or if you have your own opinion about it, write in the comments. I will be glad 👩💻

AUD/CAD💰Symbol: { AUD/CAD }
🟩Price: { 0.89120 }
🟥Stop: { 0.89400 }
1️⃣profit: { 0.88735 }
2️⃣profit: { 0.88354 }
3️⃣profit: { 0.88101 }
📊Check your chart before entering.
🚨Check before use to make sure there is no important news.🚨

AUDCAD SHORT FORECAST Q2 W24 D12 Y25AUDCAD SHORT FORECAST Q2 W24 D12 Y25
Professional Risk Managers👋
Welcome back to another FRGNT chart update📈
Diving into some Forex setups using predominantly higher time frame order blocks alongside intraday confirmation breaks of structure.
💡Here are some trade confluences📝
✅Weekly 50 EMA
✅Weekly order block rejection
✅Daily order block rejection
✅15’ order block identification
🔑 Remember, to participate in trading comes always with a degree of risk, therefore as professional risk managers it remains vital that we stick to our risk management plan as well as our trading strategies.
📈The rest, we leave to the balance of probabilities.
💡Fail to plan. Plan to fail.
🏆It has always been that simple.
❤️Good luck with your trading journey, I shall see you at the very top.
🎯Trade consistent, FRGNT X