AUD/CAD SENDS CLEAR BULLISH SIGNALS|LONG
Hello, Friends!
AUD-CAD downtrend evident from the last 1W red candle makes longs trades more risky, but the current set-up targeting 0.893 area still presents a good opportunity for us to buy the pair because the support line is nearby and the BB lower band is close which indicates the oversold state of the AUD/CAD pair.
Disclosure: I am part of Trade Nation's Influencer program and receive a monthly fee for using their TradingView charts in my analysis.
✅LIKE AND COMMENT MY IDEAS✅
AUDCAD trade ideas

AudCad..PWL taken!!Good day traders, I’m back with another setup on AudCad and I like that previous week low was taken. We can now look at the power of 3 with higher TF in mind.
On the 4H TF price has been bearish but we can see that price left very “smooth” highs(relative equal highs) but ICT teaches us that price will always go back to make the smooth highs, smooth cries(liquidity sweep).
Before price took our low it left a FVG that’s we wanna see turn into an inverse.
The first target has to be our internal liquidity than the external liquidity that also has relatively equal highs too.

Lingrid | AUDCAD potential Bearish Rally from KEY zoneFX:AUDCAD is forming a bearish continuation setup after a rejection from the lower high near the resistance trendline. Price is consolidating just below the key 0.89000 level, indicating weakness and potential for further downside. If bears maintain pressure and reject the retest, we could see a move toward the 0.88200 support zone. The downtrend remains intact as long as the pair trades below 0.89000.
📈 Key Levels
Sell trigger: bearish rejection from 0.89000
Buy zone (short-term scalp only): around 0.88200
Target: 0.88200
Buy trigger: break and hold above 0.89000
💡 Risks
Sharp reversal at 0.88200 could trap sellers
Break above 0.89000 would invalidate bearish view
Volatility expected due to CAD-linked commodities and AUD data
Traders, if you liked this idea or if you have your own opinion about it, write in the comments. I will be glad 👩💻

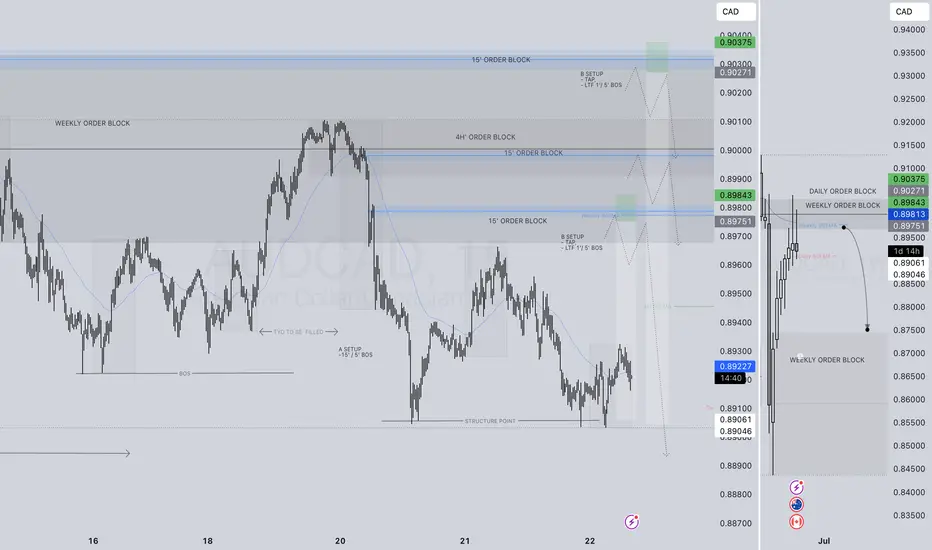
VALID POI'S AUDCAD SHORT FORECAST Q2 W22 D27 Y25🔥VALID POI'S AUDCAD SHORT FORECAST Q2 W22 D27 Y25
Professional Risk Managers👋
Welcome back to another FRGNT chart update📈
Diving into some Forex setups using predominantly higher time frame order blocks alongside intraday confirmation breaks of structure.
💡Here are some trade confluences📝
✅Weekly 50 EMA
✅Weekly order block rejection
✅Daily order block rejection
✅15’ order block identification
🔑 Remember, to participate in trading comes always with a degree of risk, therefore as professional risk managers it remains vital that we stick to our risk management plan as well as our trading strategies.
📈The rest, we leave to the balance of probabilities.
💡Fail to plan. Plan to fail.
🏆It has always been that simple.
❤️Good luck with your trading journey, I shall see you at the very top.
🎯Trade consistent, FRGNT X
AUDCAD Massive SHORTAUDCAD showing strong bearish momentum — initiating short position now. Structure breaking down with heavy selling pressure. Watching for continuation below key support zones.
🚨 Massive selling underway — stay sharp and manage risk!
#AUDCAD #ForexSignal #SellSetup #BearishMomentum

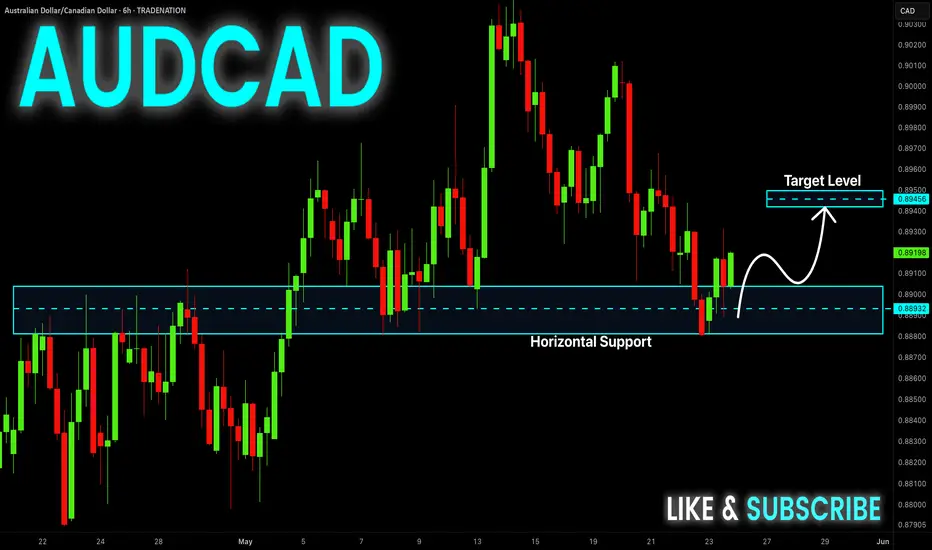
AUD/CAD - Strong Sell setup for Bearish movementsHere we can see that we are in a consolidation zone trading in a Bullish channel.
We have a Liquidity Trend Acting as a support zone for price. We are currently waiting for a breakout trade here and actively looking to possibly sell from this active supply zone if we pull into it. I do belive we may sell off sooner but time will tell.
Confluences are a failed Demand zone
Bearish Breakout Trend
Engulfing Bearish Candle theory
Good luck to any traders that may decide to follow. I have 3 Target levels marked out so feel free to follow along and use these levels

IN DEPTH HOT PICK ALERT AUDCAD SHORT FORECAST Q2 W22 D26 Y25🔥IN DEPTH HOT PICK ALERT AUDCAD SHORT FORECAST Q2 W22 D26 Y25
Professional Risk Managers👋
Welcome back to another FRGNT chart update📈
Diving into some Forex setups using predominantly higher time frame order blocks alongside intraday confirmation breaks of structure.
💡Here are some trade confluences📝
✅Weekly 50 EMA
✅Weekly order block rejection
✅Daily order block rejection
✅15’ order block identification
🔑 Remember, to participate in trading comes always with a degree of risk, therefore as professional risk managers it remains vital that we stick to our risk management plan as well as our trading strategies.
📈The rest, we leave to the balance of probabilities.
💡Fail to plan. Plan to fail.
🏆It has always been that simple.
❤️Good luck with your trading journey, I shall see you at the very top.
🎯Trade consistent, FRGNT X

AUDCAD Long Setup – Bullish Momentum BuildingI'm currently eyeing buy opportunities on AUDCAD. The pair is showing bullish structure with higher lows forming, and price is approaching a key support zone that has held well in the past. I’m anticipating a continuation to the upside if price confirms with bullish momentum or candlestick signals.
Key support: 0.89050
Target area: 0.89550
Stop-loss: 0.88850
Waiting for confirmation before entering. Open to any thoughts or alternative views!

AUDCAD SELL/ SHORTBy utilizing levels, historical patterns, , we can formulate a hypothesis that the market might follow a similar trajectory if bearish sentiment prevails.

AUD-CAD Will Go UP! Buy!
Hello,Traders!
AUD-CAD made a retest
Of the horizontal support
Level of 0.8880 and we
Are already seeing a
Bullish rebound so we are
Locally bullish biased and
We will be expecting a
Further bullish move up
Buy!
Comment and subscribe to help us grow!
Check out other forecasts below too!
Disclosure: I am part of Trade Nation's Influencer program and receive a monthly fee for using their TradingView charts in my analysis.
AUDCAD Short UpdateAfter seeing some more development the 4h has now turned bearish, lining up with my bearish bias on the Daily and Weekly timeframes. The blue zones are my daily areas of interest (support & resistance) which i would like to see price come back into to look for further opportunities short. Let me know what you think! 💭

HOT PICK ALERT AUDCAD SHORT FORECAST Q2 W22 Y25HOT PICK ALERT AUDCAD SHORT FORECAST Q2 W22 Y25
SELL SELL SELL
Professional Risk Managers👋
Welcome back to another FRGNT chart update📈
Diving into some Forex setups using predominantly higher time frame order blocks alongside confirmation breaks of structure.
💡In depth trade confluences provided during the week 📝
🔑 Remember, to participate in trading comes always with a degree of risk, therefore as professional risk managers it remains vital that we stick to our risk management plan as well as our trading strategies.
📈The rest, we leave to the balance of probabilities.
💡Fail to plan. Plan to fail.
🏆It has always been that simple.
❤️Good luck with your trading journey, I shall see you at the very top.
🎯Trade consistent, FRGNT X
AUDCAD – breakout and short likely .. the week of 26 MayThe support zone between 0.8890 and 0.8870 has been holding firm, while this pair has been making lower highs for the past couple of weeks. Price is now below the 50ema too. The most recent bounce from the zone looks rather weak and IMO a breakout to the downside may happen in the next few days.
I see an initial target around 0.8730 with the potential to go much lower. Anything can happen in the markets, so best to monitor price action on lower time frames to look for bearish evidence before committing to a trade.
This is not a trade recommendation; it’s merely my own analysis. Trading carries a high level of risk so carefully managing your capital and risk is important. If you like my idea, please give a “boost” and follow me to get even more.
It’s not whether you are right or wrong, but how much money you make when you are right and how much you lose when you are wrong – George Soros

AUDCADAUD/CAD 10-Year Bond Yield Differential and Carry Trade Advantage from technically perspective .the current10year bond yields of Australia as at Friday close of the market is 4.39% approx. while that of Canada is 3.35% .the spread is 1.044% reinforcing the AUD's yield advantage.
interest rate differential: +1.04% (AUD over CAD)
Carry Trade Advantage
The 1.04% yield spread makes AUD/CAD attractive for carry traders, who borrow low-yielding CAD to invest in higher-yielding AUD assets. For example:
Borrowing CAD at 3.35% and investing in AUD bonds at 4.39% generates a 1.04% annualized return (before currency fluctuations).
This spread is modest compared to pairs like GBP/JPY (3.21%), but still offers opportunities in stable market conditions.
Key Drivers of the Yield Differential
Australia (AUD):
The Reserve Bank of Australia (RBA) cut rates to 3.85% in May 2025, citing progress on inflation and global uncertainty from US tariffs.
Despite the cut, Australia’s 10-year yield remains elevated due to strong commodity exports (e.g., iron ore) and resilient growth.
Canada (CAD):
The Bank of Canada (BoC) maintains a restrictive policy stance, with inflation pressures persisting (trimmed-mean CPI at 3.1% in April).
Canada’s 10-year yield has risen to a four-month high (3.35%) but lags behind AUD due to weaker commodity diversification and trade risks with the US.
Risks to the Carry Trade
Currency Volatility:
AUD/CAD is in a bearish technical trend, with key support at 0.8953 and resistance at 0.9080. A breakdown could erase carry gains.
US-China trade tensions and Trump’s proposed tariffs on allies like Canada add volatility, potentially weakening AUD further.
Policy Shifts:
The RBA may ease further if global growth slows, narrowing the yield spread.
The BoC’s hawkish tilt could strengthen CAD if inflation remains sticky.
Commodity Prices:
AUD relies on iron ore and coal exports, while CAD is tied to oil. Diverging commodity trends could offset yield advantages.
Conclusion
The 1.04% yield differential provides a modest carry trade advantage for AUD/CAD. However, traders must weigh this against:
Bearish technical trends threatening AUD depreciation.
Geopolitical risks (US tariffs, China slowdown) impacting both currencies.
Divergent central bank policies (RBA easing vs. BoC holding).
While the yield spread supports long AUD/CAD positions, risk management (e.g., hedging currency exposure) is critical to preserve returns in volatile conditions.
The interest rate differential (IRD) between Australia and Canada is critically important for traders considering long or short positions on the AUD/CAD currency pair because it directly influences capital flows, currency demand, and the profitability of carry trades. Here’s why:
1. Driver of Currency Demand and Supply
When Australian interest rates are higher than Canadian rates, Australian assets (like government bonds) become more attractive to investors seeking higher returns. This increases demand for the Australian dollar (AUD) as foreign investors buy AUD to invest in these assets.
Conversely, if Canadian rates rise relative to Australian rates, the Canadian dollar (CAD) gains appeal, increasing demand for CAD and potentially weakening AUD/CAD.
Thus, the IRD affects the flow of funds between the two countries, impacting the exchange rate.
2. Impact on Carry Trade Strategy
The carry trade involves borrowing in a currency with a lower interest rate and investing in a currency with a higher interest rate to profit from the yield difference.
For AUD/CAD, if Australia’s interest rates exceed Canada’s, traders can borrow CAD at lower rates and invest in AUD assets, earning the positive interest rate differential as profit (known as rollover or swap gains).
This makes long AUD/CAD positions attractive when the IRD is positive. Conversely, a negative IRD discourages such trades or favors short AUD/CAD positions.
3. Exchange Rate Movements
Changes in the IRD signal shifts in monetary policy, economic strength, and inflation expectations, all of which influence exchange rates.
For example, if the Reserve Bank of Australia (RBA) raises rates or signals tightening while the Bank of Canada (BoC) remains steady or cuts rates, the IRD widens, typically leading to AUD appreciation against CAD.
Traders use IRD as a fundamental indicator to anticipate currency appreciation or depreciation.
4. Risk and Market Sentiment Considerations
While IRD is a key factor, traders also consider risks such as geopolitical events, commodity price fluctuations (e.g., oil for Canada, iron ore for Australia), and overall market volatility.
A favorable IRD can be offset by adverse risk factors, so traders combine IRD analysis with other economic and technical indicators.
above all never forget market structure while making critical trade decision.

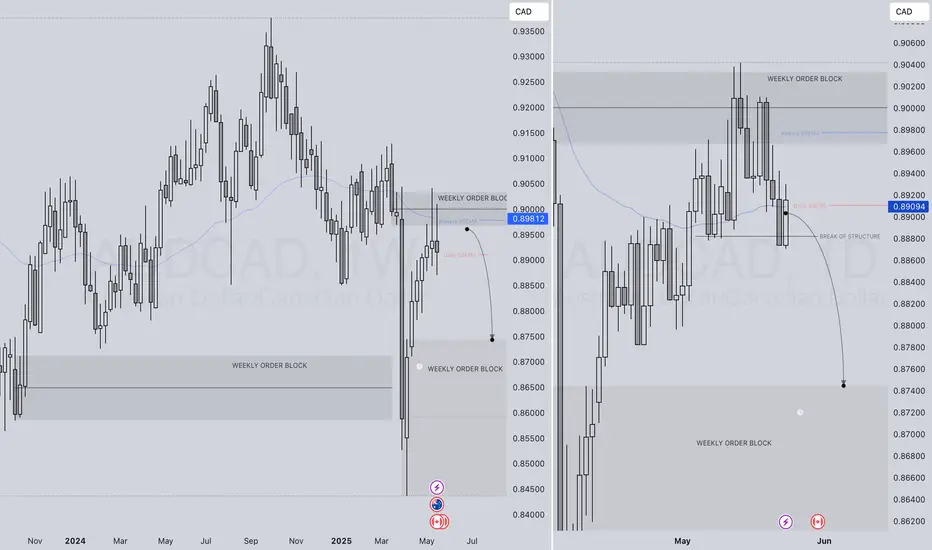
AUDCAD Shorting OpportunityHi traders,
I want to highlight a shorting opportunity for AUDCAD that seems well-suited for medium to long-term traders. Earlier in April, this pair broke a significant support level that had been established throughout 2024. For any breakout to follow through, we typically see the price revisit the rising trend line, which is currently acting as resistance.
The combination of the round number at 0.90 and strong resistance above makes this pair a compelling candidate for a drop. The risk-to-reward ratio is 1 to 2, and please note that the pair recently reached just under 10 pips away from the round number at 0.90.
Trading Setup:
- Entry: 0.8962
- Stop Loss (SL): 0.9139
- Take Profit (PT): 0.8609
I wish you all the best and encourage you to check out my three previous calls on USD pairs that I’ve attached to this post.
Happy trading!
Ehsan

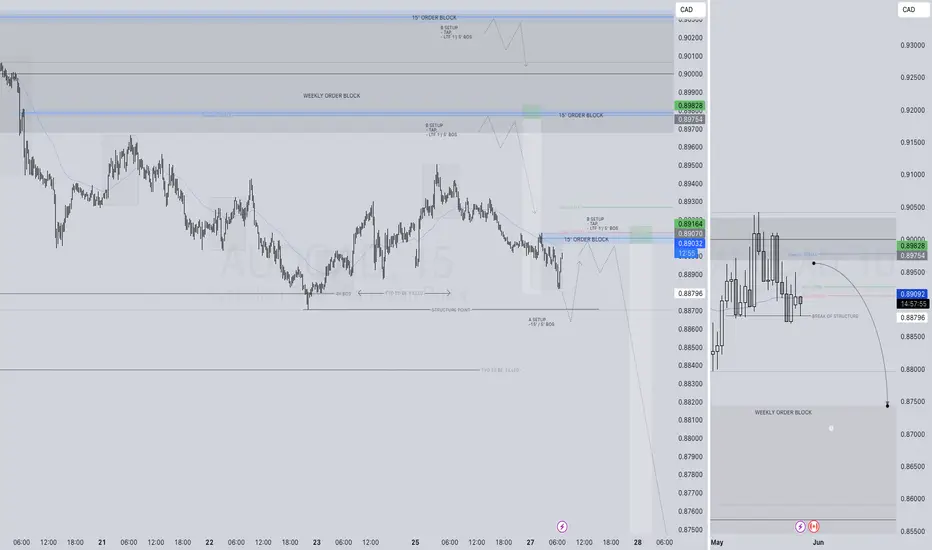
IT'S TIME AUDCAD - SHORT FORECAST Q2 W21 D23 Y25AUDCAD SHORT FORECAST Q2 W21 D23 Y25
NOW IS THE TIME! POI's are approaching. Await a turn around in price action at those points of interest & get your short shorts ready!
Professional Risk Managers👋
Welcome back to another FRGNT chart update📈
Diving into some Forex setups using predominantly higher time frame order blocks alongside confirmation breaks of structure.
Let’s see what price action is telling us today!
💡Here are some trade confluences📝
✅ Weekly order block
✅ Intraday 15 order block
✅Tokyo ranges to be filled
✅ Weekly 50 EMA
✅ Daily 50 EMA
✅ 4 hour 50 EMA
🔑 Remember, to participate in trading comes always with a degree of risk, therefore as professional risk managers it remains vital that we stick to our risk management plan as well as our trading strategies.
📈The rest, we leave to the balance of probabilities.
💡Fail to plan. Plan to fail.
🏆It has always been that simple.
❤️Good luck with your trading journey, I shall see you at the very top.
🎯Trade consistent, FRGNT X

23.05.25 Morning ForecastPairs on Watch -
FX:CADJPY
FX:AUDCAD
A short overview of the instruments I am looking at for today, multi-timeframe analysis down to what I will be looking at for an entry. Enjoy!

AUD/CAD: Ducks in a Row for a Drop Below .8880?The ducks look to be lining up for AUD/CAD downside.
It was comprehensively rejected at the 200DMA a fortnight ago, followed by wedge break on Tuesday before sliding below the 50DMA on Thursday. It now sits perched on .8880, a level it attracted buying from earlier this month.
With RSI (14) sub-50 and MACD crossing over from above, momentum signals are shifting neutral to moderately bearish, favouring downside. With both moving averages trending lower, it reinforces the bearish picture.
If AUD/CAD breaks beneath .8880, considering initiating shorts targeting a return to support at .8800. A stop above .8880 would provide protection against reversal.
Should it hold .8880, the bearish backdrop suggests there are better setups to consider than flipping the trade and going long.
Good luck!
DS

AUDCAD Swing trade ideaA lot of confluences lining up for me on this one. The weekly, daily and 4h all lining up nicely. My long term swing targets being 0.8500

AUDCAD: Bullish Continuation & Long Signal
AUDCAD
- Classic bullish formation
- Our team expects pullback
SUGGESTED TRADE:
Swing Trade
Long AUDCAD
Entry - 0.8907
Sl - 0.8880
Tp - 0.8957
Our Risk - 1%
Start protection of your profits from lower levels
Disclosure: I am part of Trade Nation's Influencer program and receive a monthly fee for using their TradingView charts in my analysis.
❤️ Please, support our work with like & comment! ❤️

AUDCAD re-entry DocumentationRe-entry on my Monday trade as no confluence was broken;
Market structure bearish on HTFs DW
Entry at Both Daily and Weekly AOi
Weekly Rejection at AOi
Previous Structure point Weekly
Daily Rejection at AOi
Previous Structure point Daily
Around Psychological Level 0.89500
H4 EMA retest
H4 Candlestick rejection
Levels 5.21
Entry 100%
REMEMBER : Trading is a Game Of Probability : Manage Your Risk : Be Patient
: Every Moment Is Unique : Rinse, Wash, Repeat!
: Christ is King.

AUDCAD is BullishPrice was in a downtrend, however the bullish divergence with a double bottom reversal pattern hints bullish control. If previous lower high is broken with good volume then we can expect an uptrend as per Dow theory. Targets are mentioned on the chart.

ALL WE NEED IS A PULL BACK.AUDCAD SHORT FORECAST Q2 W21 D22 Y25ALL WE NEED IS A PULL BACK
AUDCAD SHORT FORECAST Q2 W21 D22 Y25
Professional Risk Managers👋
Welcome back to another FRGNT chart update📈
Diving into some Forex setups using predominantly higher time frame order blocks alongside confirmation breaks of structure.
Let’s see what price action is telling us today!
💡Here are some trade confluences📝
✅ Weekly order block
✅ Intraday 15 order block
✅Tokyo ranges to be filled
✅ Weekly 50 EMA
🔑 Remember, to participate in trading comes always with a degree of risk, therefore as professional risk managers it remains vital that we stick to our risk management plan as well as our trading strategies.
📈The rest, we leave to the balance of probabilities.
💡Fail to plan. Plan to fail.
🏆It has always been that simple.
❤️Good luck with your trading journey, I shall see you at the very top.
🎯Trade consistent, FRGNT X