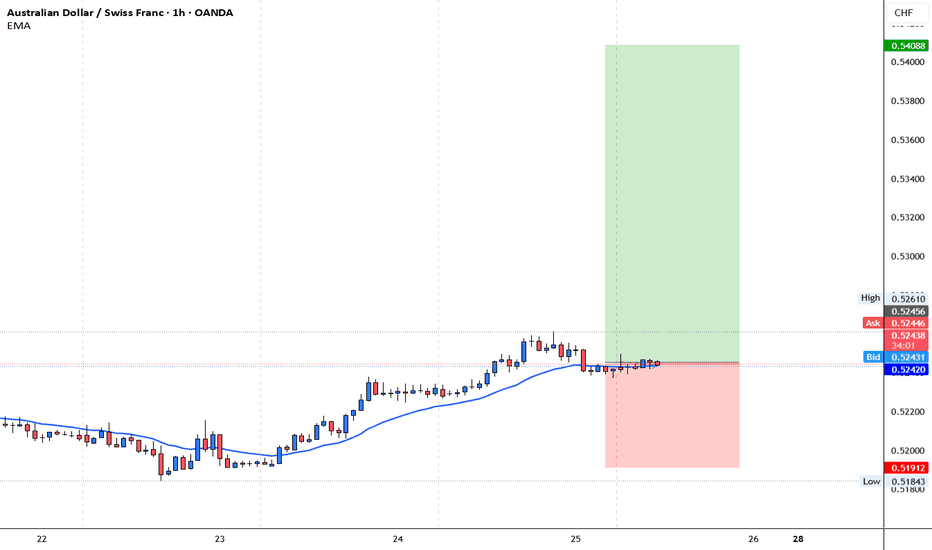
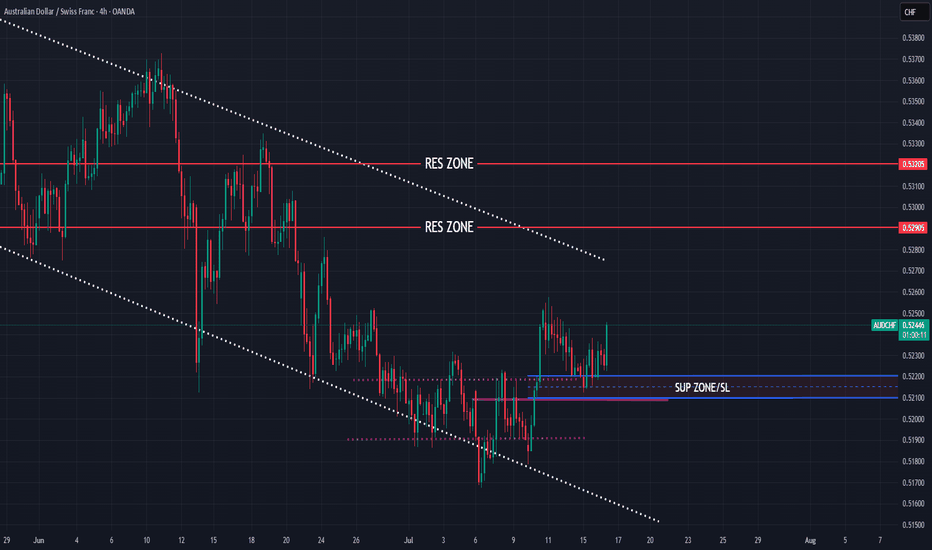
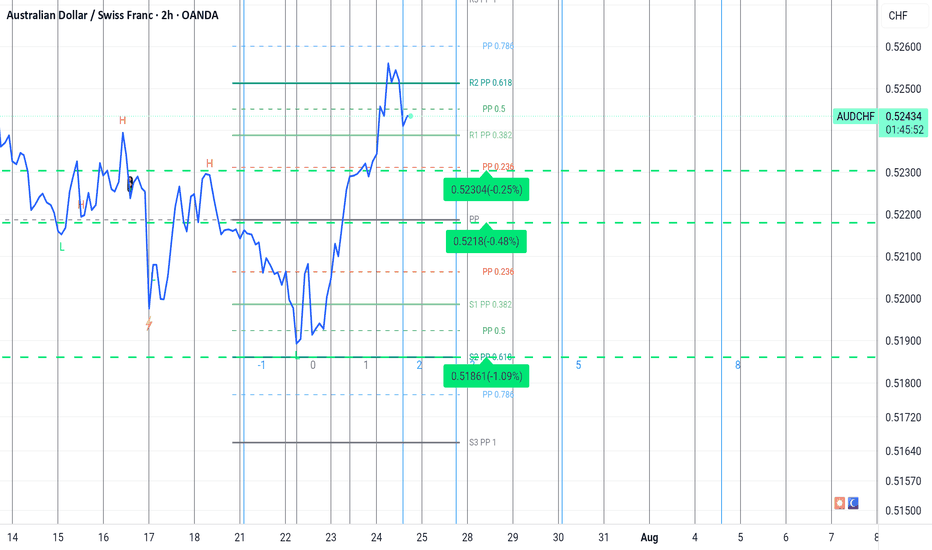
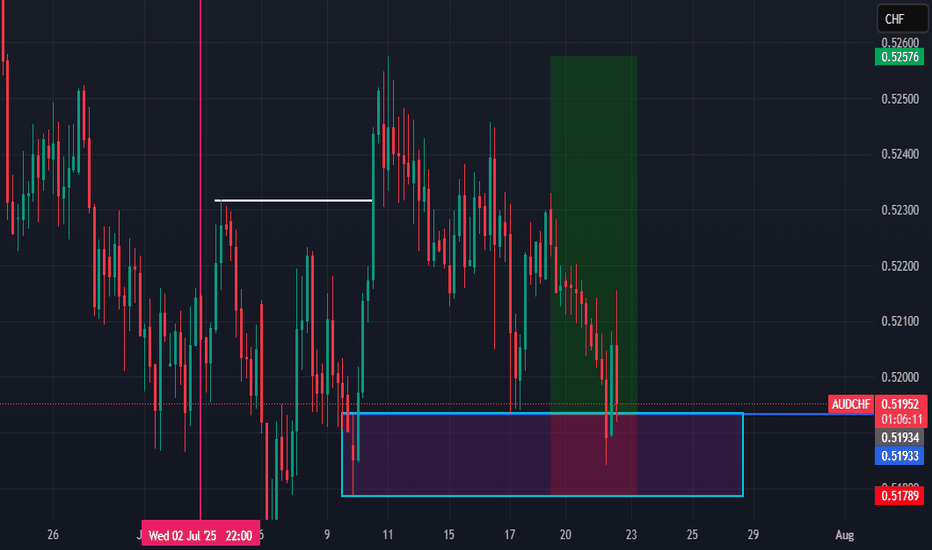
AUDCHF 4H LongBullish breakout above the Ichimoku cloud with Tenkan-Sen/Kijun-Sen bullish crossover and Chikou Span above price action. Entry near 0.568, stop at 0.565, and target at 0.572, leveraging cloud support for trend continuation.Longby ALRDNMRSKY1
Bearish reversal?AUD/CHF is rising towards the pivot which acts as a pullback resistance and could reverse to the 1st support. Pivot: 0.57044 1st Support: 0.56426 1st Resistance: 0.57549 Risk Warning: Trading Forex and CFDs carries a high level of risk to your capital and you should only trade with money you can afford to lose. Trading Forex and CFDs may not be suitable for all investors, so please ensure that you fully understand the risks involved and seek independent advice if necessary. Disclaimer: The above opinions given constitute general market commentary, and do not constitute the opinion or advice of IC Markets or any form of personal or investment advice. Any opinions, news, research, analyses, prices, other information, or links to third-party sites contained on this website are provided on an "as-is" basis, are intended only to be informative, is not an advice nor a recommendation, nor research, or a record of our trading prices, or an offer of, or solicitation for a transaction in any financial instrument and thus should not be treated as such. The information provided does not involve any specific investment objectives, financial situation and needs of any specific person who may receive it. Please be aware, that past performance is not a reliable indicator of future performance and/or results. Past Performance or Forward-looking scenarios based upon the reasonable beliefs of the third-party provider are not a guarantee of future performance. Actual results may differ materially from those anticipated in forward-looking or past performance statements. IC Markets makes no representation or warranty and assumes no liability as to the accuracy or completeness of the information provided, nor any loss arising from any investment based on a recommendation, forecast or any information supplied by any third-party.Shortby ICmarkets3
AUDCHF 2H ShortBearish setup on AUD/CHF 2H chart: Price rejects the Ichimoku cloud and Tenkan-Sen resistance, confirming a short entry. Targeting 0.5563 with a stop-loss above the cloud at 0.5636 for a favorable risk-to-reward ratio.Shortby ALRDNMRSKYUpdated 1
Australian Dollar Looks Like a Good Investment Well, now that Australian unemployment surprisingly dropped it gave the central bank’s hold-steady stance on rates some creedence. With Aussie sitting in the lower portion of ranges (E.G. here with AUDCHF)I like buying and holding the asset for longer time horizons. Small sizes, and take profits at levels, like the 200 MA, and jumping back in on pullbacks. Longby Primetrdr88224
AUDCHF: ITF CURVE ANALYSIS (5D) - UPTREND - DAYTRADER✨ AUDCHF: ITF CURVE ANALYSIS (5D) ✨ (UPTREND) BLO1 @ 0.5632 - TRIGGERED BLO2 @ 0.5566 ⏳ TP1 @ 0.59807 TP2 @ 0.6285 TP3 @ 0.65369 TP3 @ 0.68883 SLO @ 0.69859⏳(DO NOT SET, ANTICIPATE PB/REANALYZE AFTER TP4) 🔑 BLO = BUY LIMIT ORDER ITF = INTERMEDIATE TIME FRAME SLO = SELL LIMIT ORDER TP = TAKE PROFIT NOTE: Because there is an opportunity for more immediate paychecks, I've decided to provide the daytrade view to combat the long term trade I just posted, which will take some time to play out. This not so much. Quicker profits and less wait... depending on the strategy. Either way, just sharing what I'm doing. Intermediate time frames (4 hours to 6 day): — Offer a clearer picture of the underlying trend compared to short-term frames. — Provide more opportunities for confirmation signals and technical analysis. — Allow for more flexible trading schedules, trades can be held overnight. — Suitable for swing traders and some positional traders.Longby oktane3
AUDCHF 4H TFLooking for potential shorting around 0.5680 to 0.5700 after nice Price action confirmation. the bias come based on the nature of liquidity of the area, will be monitoring the area for potential shortingShortby A_markonikovvs0
AUDCHF rally imminentBe have recently seen break of a major trendline and now we are coasting over the susequent upward trendline. market structure shows a break and retestLongby marketsnxper1
AUDCHF - SHORT!Another simple set up... Rejection at the strong support zone at 0.57 Descending channel providing additional resistance Trading with the overall downtrend of this pair Shortby francesgurtonUpdated 0
AUD_CHF RISKY LONG| ✅AUD_CHF is going down now But a strong support level is ahead at 0.5600 Thus I am expecting a rebound And a move up towards the target at 0.564 LONG🚀 ✅Like and subscribe to never miss a new idea!✅Longby ProSignalsFx111
AUD-CHF Support Ahead! Buy! Hello,Traders! AUD-CHF is making a Move down but a strong Horizontal support ahead At 0.5594 from where we Will be expecting a Bullish rebound Buy! Comment and subscribe to help us grow! Check out other forecasts below too!Longby TopTradingSignals112
AUD/CHF BULLS WILL DOMINATE THE MARKET|LONG Hello, Friends! It makes sense for us to go long on AUD/CHF right now from the support line below with the target of 0.566 because of the confluence of the two strong factors which are the general uptrend on the previous 1W candle and the oversold situation on the lower TF determined by it’s proximity to the lower BB band. ✅LIKE AND COMMENT MY IDEAS✅Longby EliteTradingSignals111
4HR CHART trade long in Gold sets up. Buy-up The volatility has settled in Gold trading for now. Price has kept support at around the 50 to 55 level. So Gold has propped up during Monday. It really has not even looked like selling off and I trade Gold a lot and I can usually tell when they want to reverse the price for a bit. Buy around current price57,000 or 56,950 xauusd. Stop under a recent swing low from a 3 or 5 minute timeframe. TP1: at 70'Longby Easy_Explosive_TradingUpdated 0
AUD-CHF Will Go UP! Buy! Hello,Traders! AUD-CHF is already making A bullish rebound from the Horizontal support level Of 0.5668 while trading In a local uptrend so we Will be expecting a further Local bullish continuation Buy! Comment and subscribe to help us grow! Check out other forecasts below too!Longby TopTradingSignals111
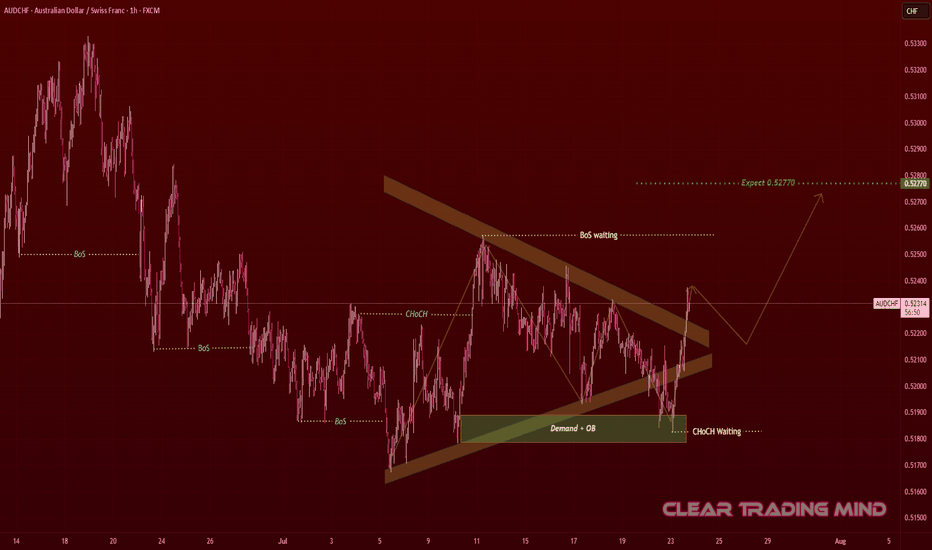
AUDCHF - 1hr timeframe buy setupWe're going attempt a first buy setup on what could be the c wave of a monthly upside move. No need to look for particular trading hours on this one as the setup is happening now, so we'll just buy at market based on the macd cross and also the stop loss will be at the previous macd cross on the 1hr time frame. Levels on the chart, trade with care.Longby TradingClear0
AUDCHF - 1H - BullishFollowing are the factors for the Bullish trend continuation: 1. No Divergence 2. Bullish Rectangle Long Trade can be executed on Bullish Break.Longby gulraizali900
AUDCHF is BullishPrice was in a downward trend respecting the descending trendline, however it formed a triple bottom formation, and broken previous lower high signaling bull's control. If the bullish momentum continues and previous higher high is broken then we can expect a reversal as per Dow theory. Targets are mentioned on the chart. Longby Fahad-Rafique0
AUDCHFAUDCHF is bearish on higher time frame on fundamental SNB’s Gov Schlegel says SNB Does Not Like Negative Interest Rates AND snp policy rate falls by 0.5% on technical AUD SHOULD KEEP BUYING06:39by Shavyfxhub0
AUDCHF: HTF CURVE ANALYSIS (3W) - UPTREND✨ AUDCHF: HTF CURVE ANALYSIS (3W) ✨ (UPTREND) BLO1 @ 0.5632 - TRIGGERED BLO2 @ 0.5566 ⏳ TP1 @ 0.61564 TP2 @ 0.6500 TP3 @ 0.6866 TP4 @ 0.73143 TP5 @ 0.7585 SLO1 @ 0.7685 ⏳ SLO2 @ 0.7725 ⏳ 🔑 BLO = BUY LIMIT ORDER HTF = HIGH TIME FRAME PA = PRICE ACTION SLO = SELL LIMIT ORDER TP = TAKE PROFIT NOTE: Our BLO has triggered but further analysis shows a potential area of interest between 0.5575 to 0.5546. Due to market conditions, PA might not make it back down to this area. However, if it does, I have a set up there to grab an deeper entry for this long term trade. Let's see what happens. Long-term time frames (1 week to 1 year): — Shows the big picture, revealing major trends and economic factors. — Less volatile, price movements are slower and smoother. — Suitable for long-term trend trading and position trading. — Requires less frequent monitoring but may offer fewer trading opportunities.Longby oktane1
AUDCHF Long Trade SetupThere's been a recent buying opportunity on the aussie-swissy trading chart, following the bullish harami candlestick pattern just above the 0.56138 horizontal support level/demand zone (this shows a rejection of the zone). A good number of FVGs also appear above the zone, indicating an imbalance in price that will be filled sooner or later by price moving upwards.Longby charles-okoukoni110
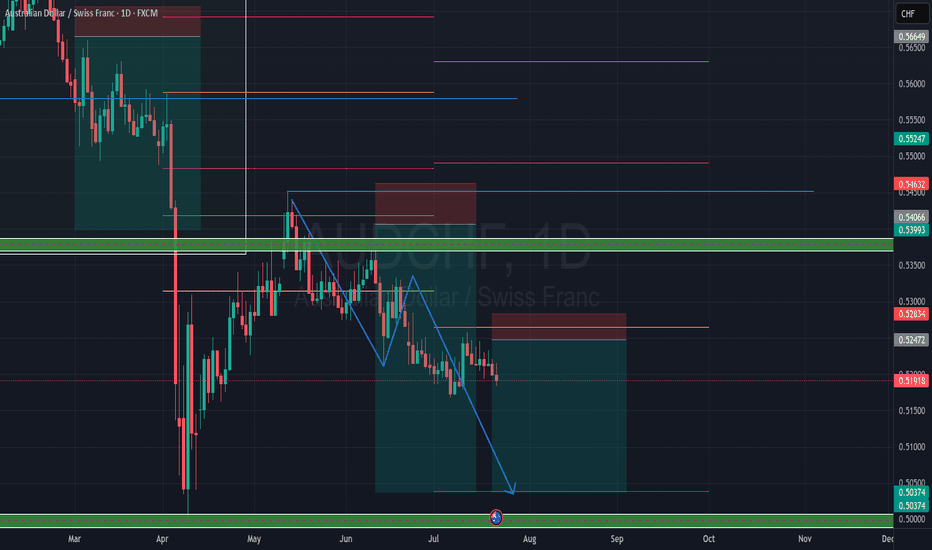
AUDCHF recent price history whilst in oversold Cond. It's the big banks who are ultimately buying very low and riding the bigger waves. Here in the daily chart for AUDCHF and its recent price history whilst generally getting hammered lower into the oversold condition. Money can be made deep and low in price here, but it will only work if you get it deeply oversold around recent price history, where it has popped. Other supporting confluence of why this needs to turnaround in price is also needed. For example, what is the path of least resistance on other timeframes. Its probably a trade for more risk and more reward, if that sounds like you then check out the daily chart of AUDCHF. The way to trade it apart from the timing, is to bet with a small lot size, you don't want to come under notice betting for example 5 Lots, you will probably get hammered lower if you get in at the wrong time. by Easy_Explosive_TradingUpdated 3
AUDCHF1. Support and resistance levels 2. Trend lines 3. Reversing patterns. 4. Interest rates Swiss National BankLongby ForexCompany1
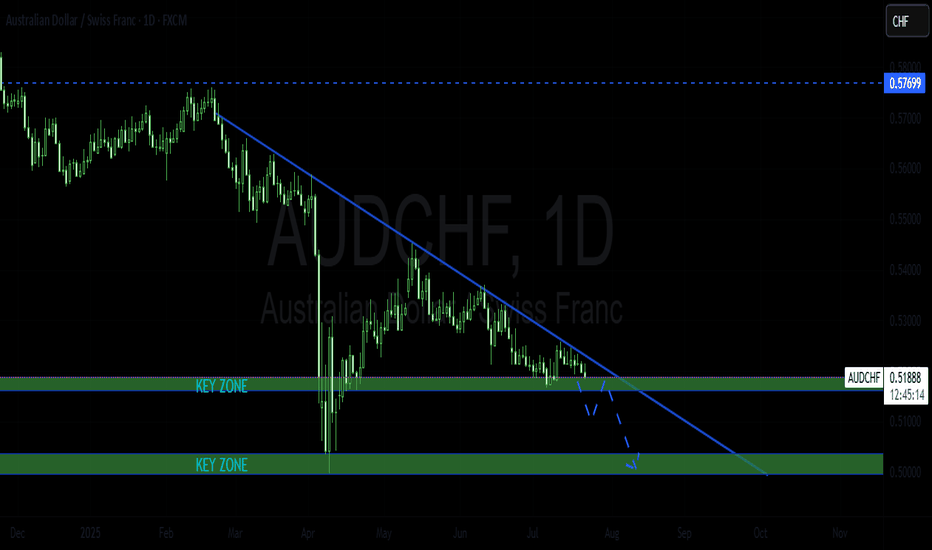
AUDCHF is BearishPrice is in a strong downtrend, and has printed a lower low followed by a lower high, the trend is more likely to continue with no divergence on RSI. Targets are mentioned on the chart. Shortby Fahad-Rafique1