EURAUD Breakdown: Bearish Continuation Ahead of ECBEURAUD is showing signs of renewed downside pressure as fundamental and technical forces align in favor of Australian dollar strength. With the European Central Bank expected to hold rates steady and provide a cautious growth outlook, the euro remains vulnerable. Meanwhile, upside surprises in Australian inflation and supportive commodity dynamics continue to boost AUD sentiment. Technically, the pair has broken down from a rising wedge, confirming bearish momentum and setting the stage for further declines toward key support near 1.7648 and potentially 1.7500.
🟢 Current Bias: Bearish
🔑 Key Fundamentals:
ECB: Markets expect the ECB to hold rates steady this week. While this ends a 7-year streak of cuts, the bank has turned cautiously neutral, with no clear signal of future tightening. Core inflation remains subdued, and growth momentum across Germany and the euro area is weak.
RBA & Australia: The RBA faces persistent inflation risks after the June CPI surprised to the upside, putting rate hikes back on the table. The Aussie dollar is drawing strength from this, especially with rising commodity prices and China's potential fiscal stimulus aiding demand-side confidence.
Macro Divergence: Australia’s macro picture is improving vs. the eurozone. AUD has tailwinds; EUR is under pressure from stagnant growth and tepid inflation outlook.
⚠️ Risks to Bias:
ECB Surprise: A sudden hawkish tone from the ECB (e.g., lifting forecasts or emphasizing wage-driven inflation risk) could spark short-term EUR upside.
RBA Softness: A dovish RBA pivot or weak Aussie data could weaken AUD strength and slow EURAUD downside.
Geopolitical Risk: Broader global volatility (e.g., US-China, oil disruptions) could cause flows into euro as a semi-safe haven.
📅 Key News/Events to Watch:
ECB Rate Decision & Press Conference – July 25
Eurozone Flash GDP + CPI – Next week
China industrial data (AUD-sensitive)
RBA August Meeting Statement (early Aug)
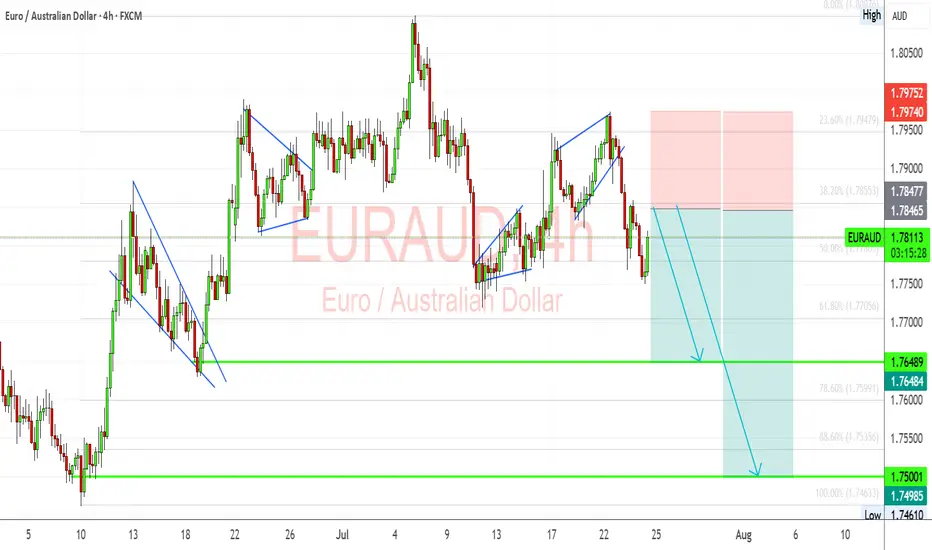
📉 Technical Breakdown (4H Chart):
Price broke bearish from a wedge consolidation.
Minor bullish pullbacks are being sold into, confirming a distribution phase.
Targets:
1st Target: 1.76480 (support & fib confluence)
2nd Target: 1.7500–1.7460 zone (major swing low)
Resistance: 1.7855–1.7975 zone is key invalidation area.
Structure favors lower highs & continuation patterns until support zones break.
🧭 Leader/Lagger Behavior:
AUD is leading the move. Strong CPI and China demand backdrop are fueling bullish AUD momentum.
EUR is lagging, tracking broader USD risk tone and internal Eurozone data weakness.
EURAUD is currently reactive to external forces rather than setting direction for other pairs.
✅ Summary: Bias and Watchpoints
Bias: Bearish
Fundamentals: Weak Eurozone growth vs. hotter Aussie inflation and hawkish RBA tone.
Risk: ECB hawkish tilt or a dovish shift from the RBA.
Event to Watch: ECB press conference and Aussie CPI commentary from policymakers.
Leader/Lagger: Lagger — following AUD strength rather than leading.
AUDEUR trade ideas
EURAUD Ready to Bounce? Key Support & Fundamentals Aligned!Today I want to share a Long position idea on EURAUD ( OANDA:EURAUD ) with you.
From a fundamental perspective , both the Euro (EUR) and Australian Dollar (AUD) are currently under pressure. However, the Aussie appears fundamentally weaker in the short term, making the EURAUD Long setup more favorable at this stage.
AUD Weakness :
The Reserve Bank of Australia (RBA) has held rates steady at 3.85%, but recent inflation data has dropped to 2.7%, the lowest in over 3 years.
Most economists now expect the RBA to cut rates in its next meeting in August, possibly by 25 basis points.
Slowing economic growth and dovish forward guidance from the central bank are weighing heavily on AUD sentiment.
EUR Outlook :
The European Central Bank (ECB) is also facing weak economic data, but is taking a more cautious approach toward cutting rates.
Despite softer PMIs and sluggish growth in countries like Germany and France, the ECB has not confirmed a near-term rate cut, keeping EUR relatively stable.
This divergence between the RBA’s dovish stance and the ECB’s pause is supportive of EUR strength against AUD.
Summary :
With the RBA likely to ease policy soon and the ECB holding ground for now, the interest rate differential favors EURAUD upside. Fundamentals point toward further weakness in AUD, making the EURAUD Long a strategically sound trade idea for the coming days.
-------------------------------------------
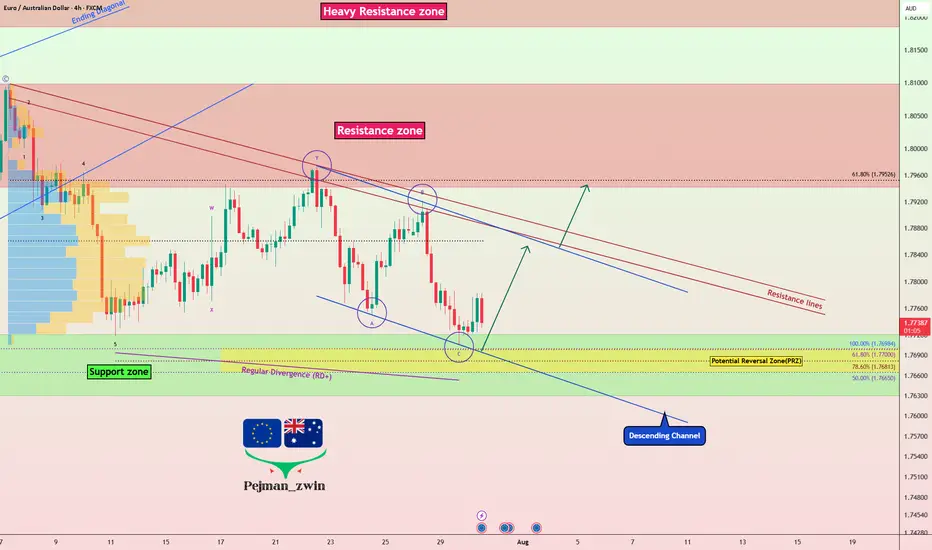
Now let's analyze the conditions of the EURAUD chart on the 4-hour time frame .
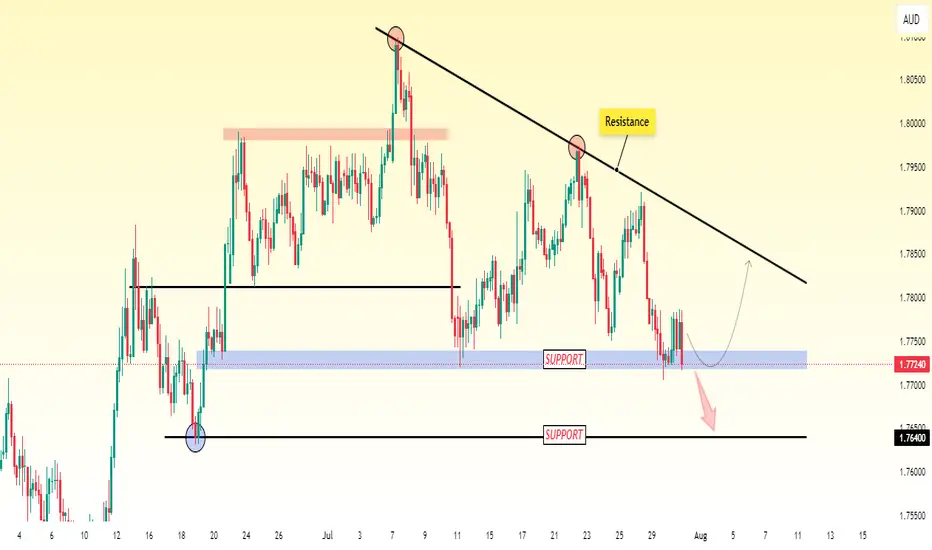
EURAUD is currently trading near the Support zone(1.772 AUD-1.763 AUD) , Potential Reversal Zone(PRZ) , and near the lower line of the descending channel .
According to Elliott Wave theory , EURAUD appears to have completed a Zigzag Correction(ABC/5-3-5) .
Also, we can see the Regular Divergence(RD+) between Consecutive Valleys .
I expect EURAUD to rise to at least 1.784 AUD .
Second Target: 1.792 AUD
Note: Stop Loss(SL): 1.762 AUD
Please respect each other's ideas and express them politely if you agree or disagree.
Euro/Australian Dollar Analyze (EURAUD), 4-hour time frame.
Be sure to follow the updated ideas.
Do not forget to put a Stop loss for your positions (For every position you want to open).
Please follow your strategy and updates; this is just my Idea, and I will gladly see your ideas in this post.
Please do not forget the ✅' like '✅ button 🙏😊 & Share it with your friends; thanks, and Trade safe.
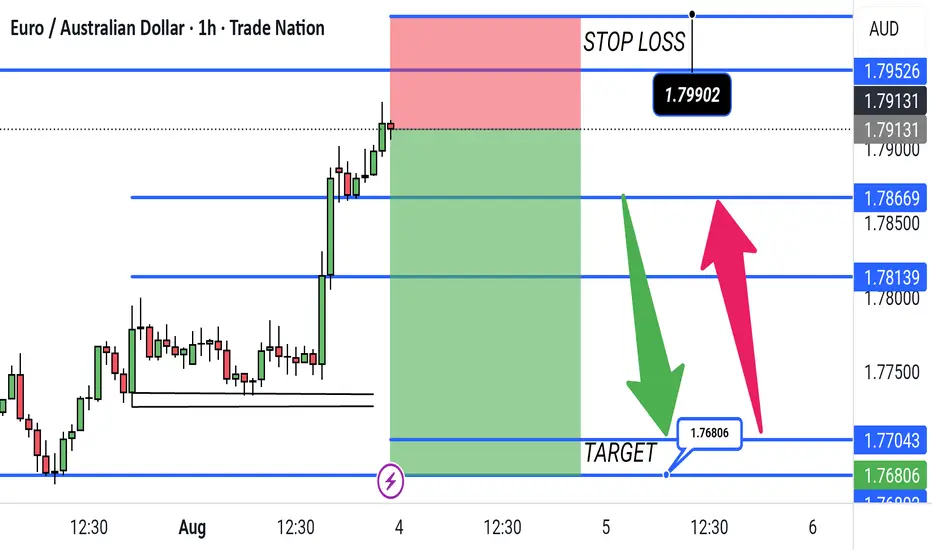
EURAUD Short Trade Setup Targeting 1.76806 with Stop at 1.79902This is a 1-hour EUR/AUD trading chart showing a short (sell) setup. The entry is near the current price level, with a target at 1.76806 and a stop loss at 1.79902. The green arrow indicates the expected downward move, while the red arrow shows the risk of upward movement if the trade goes against the plan.
EUR/AUD: Short Setup Forming—Is the Downside Just Beginning?EUR/AUD is flashing the early signs of a new short trading opportunity, with the latest chart pointing toward a fresh move lower as the corrective phase may be wrapping up.
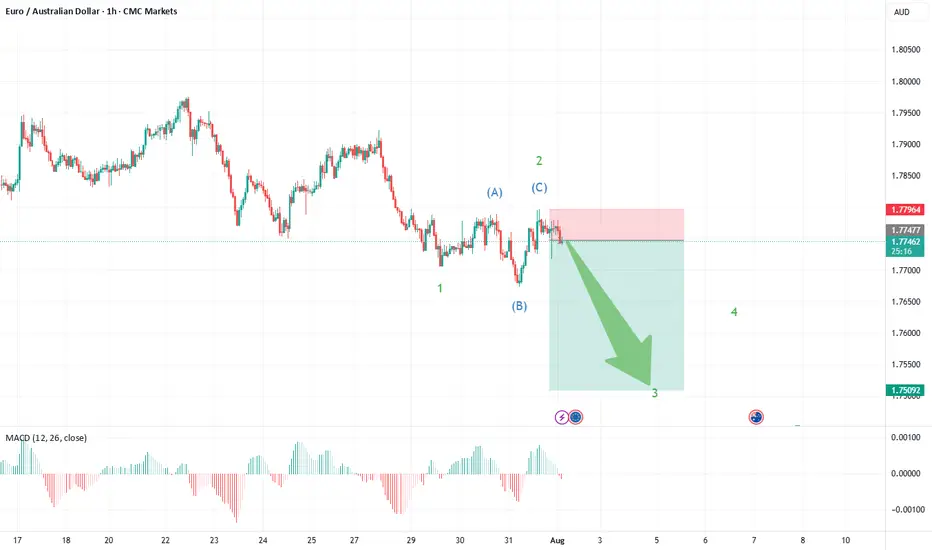
What the Current Structure Shows (Primary Scenario)
Corrective Pattern Complete: The strong advance off the May 14th, 2025 lows at 1.7247 unfolded as a classic double zigzag (WXY), culminating at recent highs. Price action has since reversed and formed an initial impulse down—clear evidence that the correction may be over.
Wave 1 Down, Expanded Flat for Wave 2: The chart now displays a completed wave 1 on the downside, followed by an expanded flat for wave 2—where price retraced upward but failed to break the previous peak, a sign of fading bullish momentum.
The recent structure shows a sharp, impulsive move down (wave 1), fitting Elliott Wave expectations for a new trend immediately after a complex correction.
The expanded flat for wave 2—where the B wave exceeded the start of A and C pushed higher—typically heralds a strong, extended wave 3. This supports a bearish outlook from current levels.

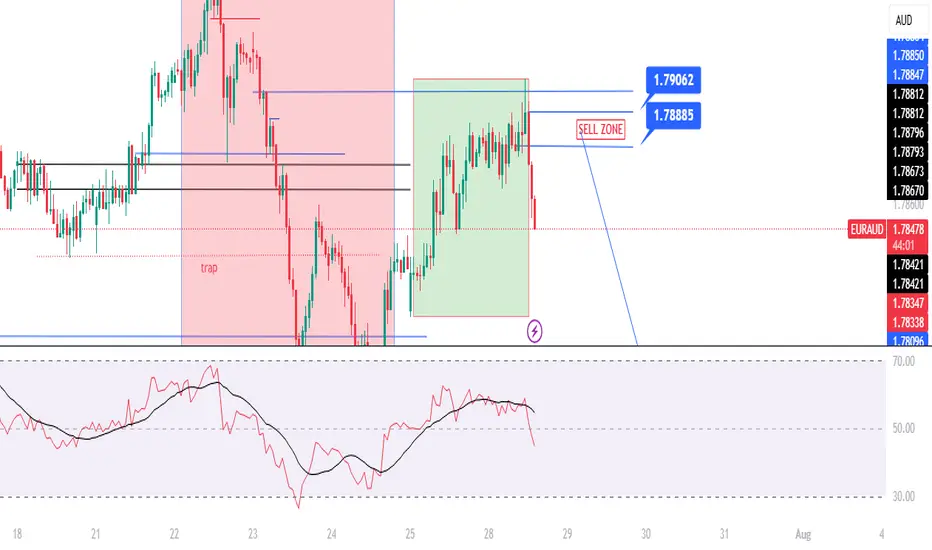
EURAUD: Bullish Move After a Trap 🇪🇺 🇦🇺
There is a high chance that EURAUD will rise from the underlined support.
A confirmed liquidity grab and a consequent bullish imbalance
provide a strong confirmation.
Goal - 1.7794
❤️Please, support my work with like, thank you!❤️

EURAUD to see a temporary move lower?EURAUD - 24h expiry
The primary trend remains bullish.
The selloff is close to an exhaustion count on the daily chart.
Preferred trade is to buy on dips.
Risk/Reward would be poor to call a buy from current levels.
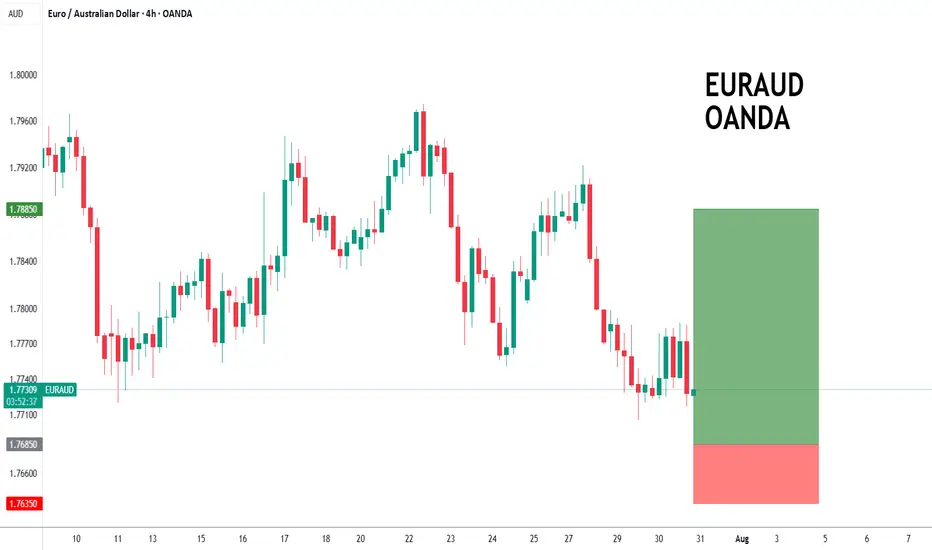
Bespoke support is located at 1.7685.
We look to Buy at 1.7685 (stop at 1.7635)
Our profit targets will be 1.7885 and 1.7910
Resistance: 1.7850 / 1.7910 / 1.7950
Support: 1.7700 / 1.7680 / 1.7630
Risk Disclaimer
The trade ideas beyond this page are for informational purposes only and do not constitute investment advice or a solicitation to trade. This information is provided by Signal Centre, a third-party unaffiliated with OANDA, and is intended for general circulation only. OANDA does not guarantee the accuracy of this information and assumes no responsibilities for the information provided by the third party. The information does not take into account the specific investment objectives, financial situation, or particular needs of any particular person. You should take into account your specific investment objectives, financial situation, and particular needs before making a commitment to trade, including seeking, under a separate engagement, as you deem fit.
You accept that you assume all risks in independently viewing the contents and selecting a chosen strategy.
Where the research is distributed in Singapore to a person who is not an Accredited Investor, Expert Investor or an Institutional Investor, Oanda Asia Pacific Pte Ltd (“OAP“) accepts legal responsibility for the contents of the report to such persons only to the extent required by law. Singapore customers should contact OAP at 6579 8289 for matters arising from, or in connection with, the information/research distributed.
EURAUD is poised to confirm a bearish Head & Shoulders pattern.EURAUD is poised to confirm a bearish Head & Shoulders pattern.
The price could move higher today on hopes that the ECB can share some positive news on the economy and interest rates.
The European Central Bank is expected to keep interest rates unchanged, ending a seven-year streak of cuts.
If the price manages to break below the neckline of the pattern, it will open the door for further declines.
The first support zone will be found near 1.7640 and the second near 1.7500.
You may find more details in the chart!
Thank you and Good Luck!
PS: Please support with a like or comment if you find this analysis useful for your trading day
Disclosure: I am part of Trade Nation's Influencer program and receive a monthly fee for using their TradingView charts in my analysis.
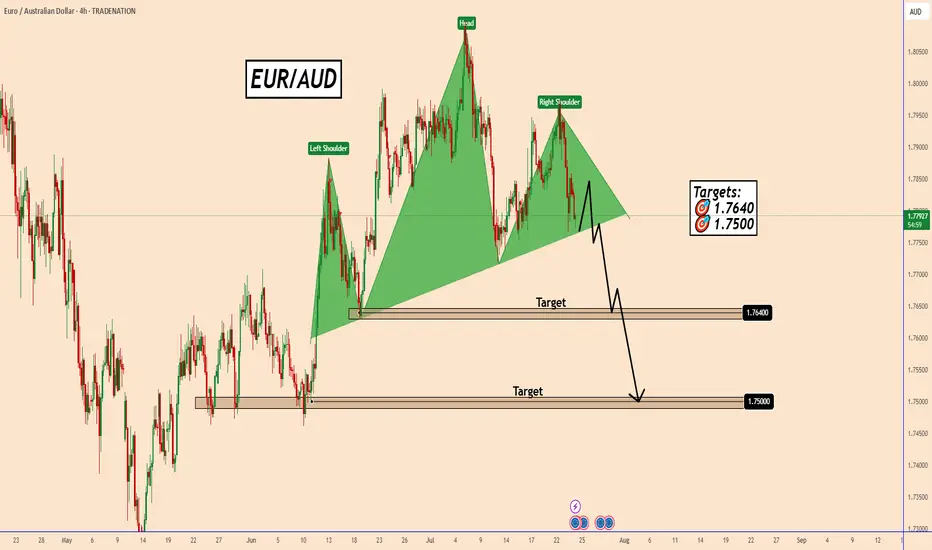
EURAUD - Bearish H*S Retesting Double Tops LevelEURAUD is approaching a strong reversal area which we could see a retest before the next leg down. Wait for bearish confirmation on LTF before entry.
Good Luck

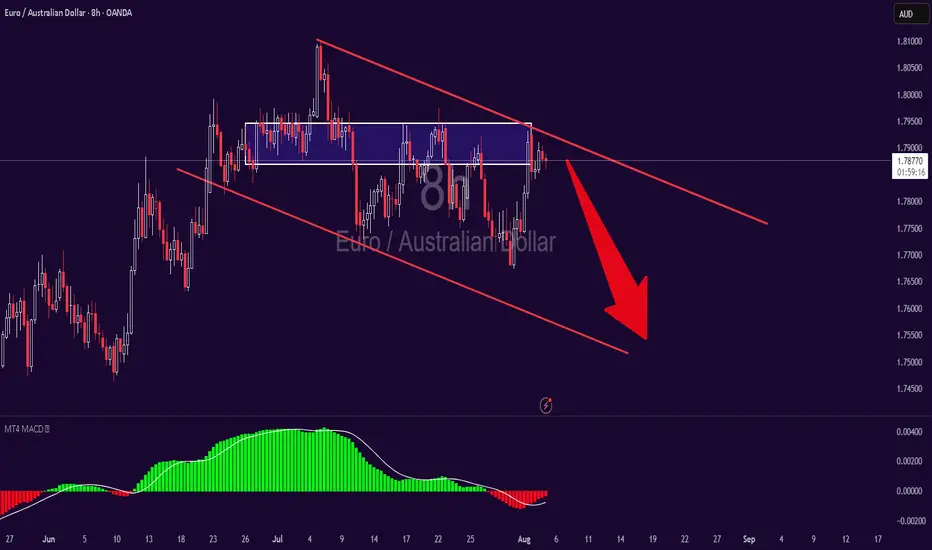
Loss of Momentum Pattern Into StructureSimilar to the OANDA:GBPJPY that I shared, the OANDA:EURAUD has put in a pretty aggressive and direct move into a previous level of structure. However, what makes this opportunity different than "the beast" is that as price approach our level of resistance we started to put in a rising channel which is a loss of momentum pattern along with other clues such as divergence on the RSI.
If you have any questions, comments or want to share your views, please do so below. Also be sure to hit that like button & give me a follow, that way you don't miss my future trading ideas.
Akil

EURAUD Potential Bearish Setup Distribution pattern with breakdown below key support suggests downside momentum.
Break above our Resistance zone will invalidate our trade setup; good idea to watch out if that happens.
- Breakdown Level: 1.77694 -1.77722
- Entry Strategy: Sell orders at BOS
- Stop Loss: Above Resistance zone
- Target Zones:
- Primary Target: Target 1 (R:R 1:2)
- Secondary Target: Target 2 (R:R 1:3)
- Extension Target: Target 3 (R:R 1:4)
Bearish/Bullish Confirmations:
🔻 Rejection candlestick patterns
🔻 Bearish Reversal patterns
🔻 Impulsive moves in line with setups directional bias
Position Management:
- Exit: Partial profits at targets
- Stop adjustment: Trail stops when target are hit
LIKE or COMMENT if this idea sparks your interest, or share your thoughts below!
FOLLOW to keep up with fresh ideas.
Tidypips: "Keep It Clean, Trade Mean!"

EURAUD – Looking to Fade the Rally at Resistance (Counter-Trend EURAUD – Looking to Fade the Rally at Resistance (Counter-Trend Short Idea)
Sometimes markets climb too far, too fast — and that’s when opportunity knocks. EURAUD has been riding a strong uptrend, but it’s now stalling at a key resistance zone. Both the Euro and the Aussie are fundamentally soft, and this looks like a moment to bet against momentum.
🔻 I’m bearish on EURAUD as a counter-trend short from resistance.
Here’s what’s behind my view:
EUR strength is built on shaky optimism around a potential US-EU trade deal.
Eurozone growth is nearly flat (+0.1% in Q2), and household consumption is falling.
ECB is in pause mode after 8 rate cuts, with inflation expected below target until 2026.
AUD weakness is priced in as markets expect an August rate cut from the RBA.
Both currencies are fundamentally soft — but EUR feels overstretched after a 17% rally.
Zooming out, Euro sentiment is cautiously bullish, but it’s a fragile optimism. Positioning is crowded long (123K net longs), and any disappointment on the trade front could trigger a reversal. Meanwhile, the RBA’s expected dovish move is already in the price — and the AUD has already pulled back 1.4% vs USD.
This setup is risky — I’m going against the broader trend — but I like the odds here. EURAUD is overbought, fading momentum, and sitting right at resistance. If price confirms rejection, I’ll be looking to take a short with tight risk.
⚠️ It’s a counter-trend trade — not for the faint-hearted.
Would you fade this rally? Or are you still riding the Euro wave?

EURAUD Short From Resistance!
HI,Traders !
#EURAUD keeps growing
In an uptrend but the pair
Will soon hit a horizontal
Resistance of 1.79647 from
Where we will be expecting
A local bearish pullback
And a further move down !
Comment and subscribe to help us grow !

EURAUD: Pullback or Launch Pad?Price held right above the 0.382 Fibonacci and 200 EMA — a textbook bullish signal.
If it keeps structure here, I’ll be watching for another push into that supply zone above.
Momentum’s on our side… now we wait

EURAUD; Heikin Ashi Trade IdeaIn this video, I’ll be sharing my analysis of EURAUD, using FXAN's proprietary algo indicators with my unique Heikin Ashi strategy. I’ll walk you through the reasoning behind my trade setup and highlight key areas where I’m anticipating potential opportunities.
I’m always happy to receive any feedback.
Like, share and comment! ❤️
Thank you for watching my videos! 🙏

EUR/AUD BEARS ARE GAINING STRENGTH|SHORT
EUR/AUD SIGNAL
Trade Direction: short
Entry Level: 1.777
Target Level: 1.768
Stop Loss: 1.782
RISK PROFILE
Risk level: medium
Suggested risk: 1%
Timeframe: 2h
Disclosure: I am part of Trade Nation's Influencer program and receive a monthly fee for using their TradingView charts in my analysis.
✅LIKE AND COMMENT MY IDEAS✅

Eur/Audin this pair we can buy save i dont see sell signals , any way be cearful use money management

EUR/AUD..ShortAccording to the COT report the Euro will be weak this week plus price retraced to a resistance area to continue to the down side.
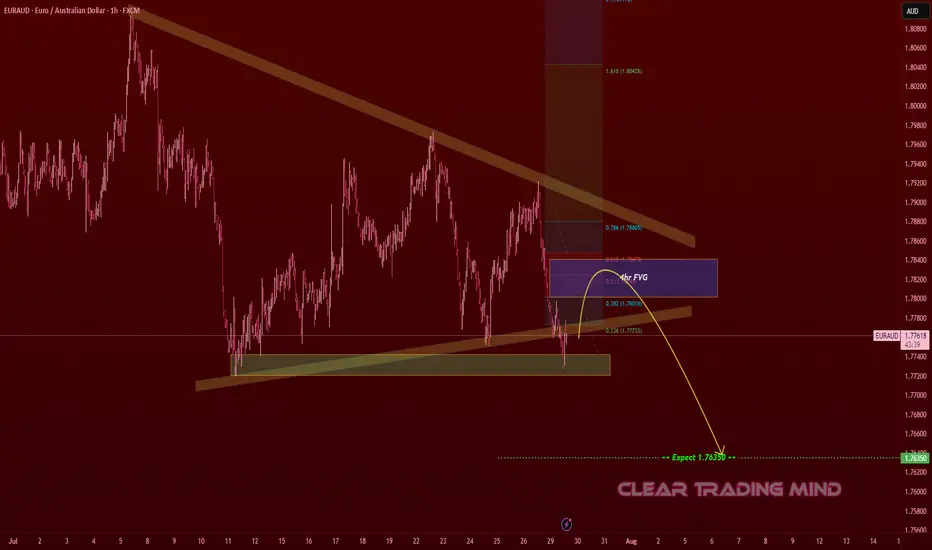
EURAUD Bearish Pullback – Short From 4hr FVG to 1.7635EURAUD – Bearish Outlook
- Key Zone: 4hr FVG (Fair Value Gap) near 1.7800 – 1.7820
- Fibonacci Levels: Retracement aligns with 0.5 – 0.618 zone, potential reaction point.
- Expected Target: 1.76350
Analysis:
1. Market shows a downward structure with lower highs and lower lows.
2. A possible pullback into the FVG zone could trigger a bearish continuation.
3. Confluence with Fibonacci levels strengthens the case for short trades targeting 1.76350.
EUR/AUD Testing Support - Drop Incoming?EUR/AUD is sitting on an important support level. So far, the price has been holding, but it's starting to show signs of weakness.
If the price breaks below this support, it could drop further, with the next target around 1.7640.
This level could act as the next area where the price might slow down or bounce.
EURAUD THE CURRENT PRICEACTION OF EURAUD IS WATCHED.
EU10Y=2.689%
ECB RATE 2.0%
AU10Y= 4.348%
RBA RATE =3.85%
RATE AND BOND YIELD DIFFERENTIAL FAVOR AUD .
The recent fluctuations in the EUR/AUD exchange rate are primarily driven by factors including:
Monetary Policy and Interest Rate Differentials:
Decisions and outlooks from the European Central Bank (ECB) and the Reserve Bank of Australia (RBA) strongly impact EUR/AUD. Hawkish (tightening) or dovish (easing) policy stances influence demand for each currency, affecting the exchange rate. For example, higher interest rates or hawkish tones usually strengthen a currency, while easing weakens it. Differences in inflation rates and inflation expectations also play a part, as central banks adjust rates accordingly.
Economic Indicators and Growth Outlooks:
Economic performance disparities between the Eurozone and Australia—such as GDP growth, trade balances, and industrial versus commodity exports—drive currency strength or weakness. The Eurozone’s economy is more industrial and technological, while Australia's economy is strongly commodity-driven, especially by prices of iron ore and gold. Changes in global commodity prices or demand can cause the AUD to fluctuate vs the EUR.
Commodity Prices, Especially Gold:
Since Australia is a major gold producer, AUD tends to correlate positively with gold prices. Rising gold prices support AUD strength, which may lower EUR/AUD rates, and vice versa.
Global Risk Sentiment and Geopolitical Events:
Global market sentiment—whether investors seek risk or safe-haven assets—affects both currencies. The Euro and AUD react differently to geopolitical developments and trade tensions. For instance, increased risk appetite can strengthen AUD vs EUR and vice versa depending on circumstances.
In summary, the recent EUR/AUD fluctuations reflect the interplay of ECB and RBA policies, divergent economic data between Europe and Australia, commodity price movements (notably gold), and shifting global risk sentiment.
This explains why EUR/AUD rates move as they do: when the Eurozone outlook improves or ECB signals tightening while Australian commodity prices weaken or RBA signals easing, EUR tends to strengthen against AUD, and the pair rises. Conversely, stronger Australian growth, rising commodity prices, or hawkish RBA moves can push the pair lower.
#EURAUD

EURAUD | One Kiss from 1.7906 and I’m In – TP 140 Pips!The big picture of EURAUD is SELL possible up to 1.7750
Spot that H1 BUY range?
Inside it, there is conflict. A sneaky SELL range form inside it after rejection H4 BLUE LINE.
See that top blue line at 1.7916?
It got a gentle kiss from the H4 candle (REJECTION).
Then H1 already whispered, "a sweet breakout"!
📌LONG STORY SHORT, I'M SELL AROUND 1.7888 - 7906
If H4 comes and kisses one of the line (just a touch and wick), I’m SELLING — no more playing hard to get. 😘
Other wise, I’ll quietly cry in the corner
TP? 1.7750 — that’s a sweet 140-candlelit dinner!
WISH ME LUCK...!!!
EURAUD is currently showing signs of a bearishEURAUD is currently showing signs of a bearish trend continuation. Despite short-term upward movement driven by optimism around the ECB, the overall structure remains vulnerable to downside pressure.
The European Central Bank (ECB) is expected to keep interest rates unchanged, potentially ending a seven-year streak of cuts. While this could bring temporary strength to the Euro, the technical setup still favours the bears.
Watch for a Break Below the Neckline
If price manages to break below the neckline of the current pattern, it could trigger a strong bearish move. First support: 1.77100 Second support: 1.76300
You May find more details in the chart.
Ps: Support with like and comments for more analysis.
