Euraud sell alert Trading the trend , saw my break of structure and went down to 5m tf for my confirmation so I met it I am in for a sell let's go
AUDEUR trade ideas

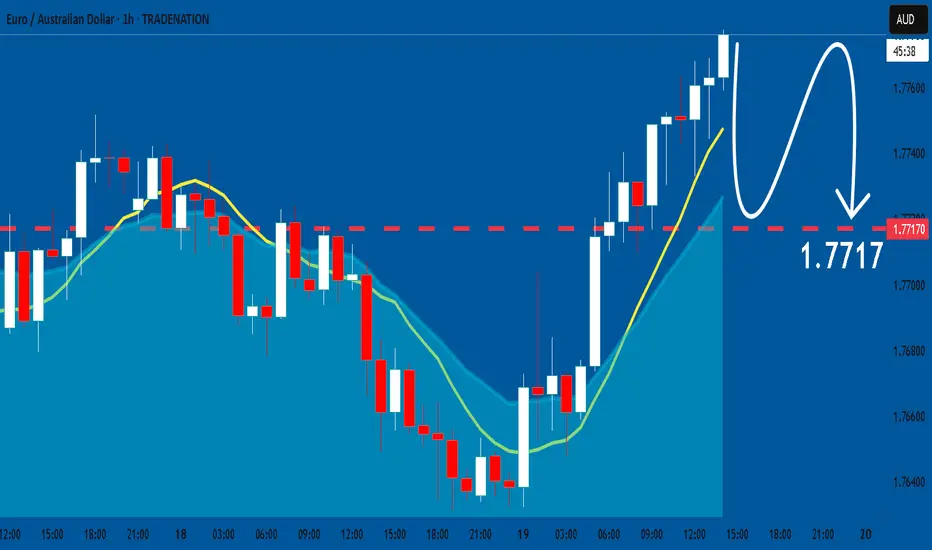
EURAUD: Aussie Strength Supported by Peace in the Middle EastEURAUD: Aussie Strength Supported by Peace in the Middle East
EURAUD confirmed a small double top pattern, and news of a ceasefire in the Middle East between Israel and Iran gave the Aussie a boost.
All the candles have been read so far, showing that the AUD has come back stronger.
Given that it has been overbought for a long time, it's expected that a small pause will occur before EURAUD can fall further.
The first target I am looking at is near 1.7740 and 1.7650.
You may find more details in the chart!
Thank you and Good Luck!
❤️PS: Please support with a like or comment if you find this analysis useful for your trading day❤️
Disclosure: I am part of Trade Nation's Influencer program and receive a monthly fee for using their TradingView charts in my analysis.

The 4 Pillars of Price Action Trading Explained!!!!!All the information you need to find a high probability trade are in front of you on the charts so build your trading decisions on 'the facts' of the chart NOT what you think or what you want to happen or even what you heard will happen. If you have enough facts telling you to trade in a certain direction and therefore enough confluence to take a trade, then this is how you will gain consistency in you trading and build confidence. Check out my trade idea!!
www.tradingview.com

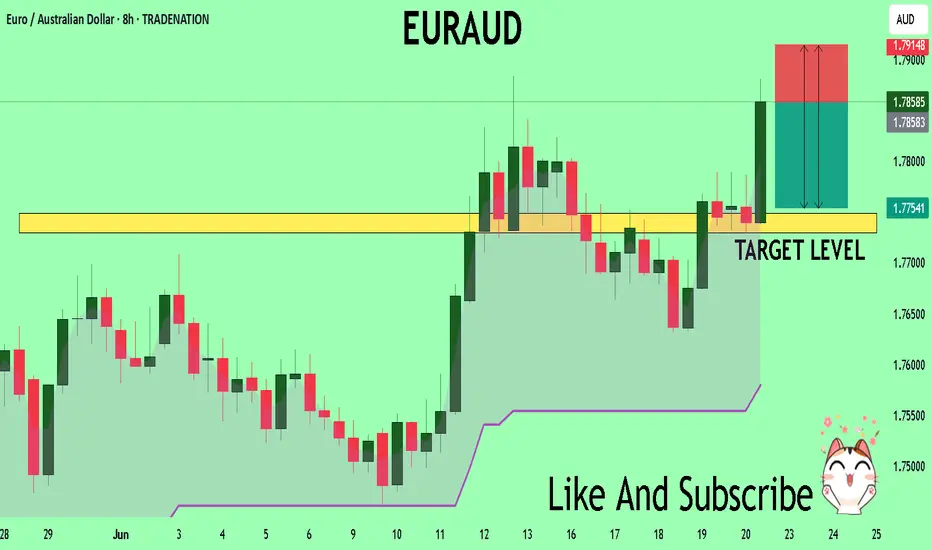
EUR_AUD WILL KEEP GROWING|LONG|
✅EUR_AUD is trading in an
Uptrend and the pair is
About to retest the broken
Key level of 1.7850 which is
Now a support so we are
Bullish biased and we will be
Expecting a local bullish rebound
LONG🚀
✅Like and subscribe to never miss a new idea!✅
Disclosure: I am part of Trade Nation's Influencer program and receive a monthly fee for using their TradingView charts in my analysis.

Call for a short at this strong lvl? Looks like this has meet a pretty strong resistance lvl. If this candle closes engulfing, the previous candle. I will mostly likely take a short to the next lvl. Probably at 3pm after the spreads tighten up. Let see what happens. You never know.

#003 Investment Opportunity LONG EUR/AUD
The EUR/AUD pair is showing an interesting technical-macro context that suggests a possible bullish development in the next sessions. The analysis conducted integrates multi-timeframe elements, advanced indicators, institutional positioning and macroeconomic context, concluding in a coherent view in favor of a long position.
🔍 Multi-timeframe technical analysis (8H, D, W)
On 8H and daily timeframes, EUR/AUD has broken the descending bearish trendline and is building a new structure of higher lows above the long-term moving average. The weekly chart shows a consolidation above the static support of 1.7400, with candles that are starting to configure potential reversals.
📊 Main technical indicators
WaveTrend and RSI are bullish but not overbought, offering room for further extensions.
The Stochastic has just crossed upwards in the restart zone, confirming the market's intention to reverse the previous bearish push.
🌀 Harmonic patterns and cyclical
We are in the initial phase of a new bullish cycle. The completion of a possible "inverse Gartley" pattern coincides with the currently tested technical support levels. The short-term cyclical shows a clear end of the previous bearish cycle.
🧱 Key supports and resistances
The price has bounced strongly from the dynamic support represented by the 200-hour moving average and the static support in the 1.7420 area. The immediate target is the structural resistance at 1.7950, already tested in the past as a reaction point.
📈 Volumes and volume profile
The volume profile highlights a strong accumulation in the area between 1.7450 and 1.7550. No excess visible in the distribution, which suggests a still “light” movement with potential for expansion.
🕯 Candlestick patterns and price action
The last 8H candle is a bullish engulfing, closed above the moving average and with increasing volumes. The three previous candles show a compression and accumulation pattern.
🔗 Correlations and geometries
The divergence with AUD/USD (which appears weak) and the inverse correlation with EUR/JPY in strengthening give further strength to the bullish picture. Historical fractals also show symmetries that have occurred in similar macro contexts.
📊 Pattern Statistics
Similar patterns on EUR/AUD – post trendline breakout with bullish structure on 8H – have shown a positive outcome in 81% of cases on historical samples greater than 100.
📉 Retail Positioning
Current sentiment shows retail heavily positioned short, creating a potential contrarian effect in favor of buyers.
🏦 Institutional Positioning (COT)
COT data signals an increase in net long positions on the euro and a reduction on AUD, compatible with a directional reversal.
🧮 Fundamental Macroeconomic Analysis
EUR supported by expectations of monetary stabilization by the ECB, without new imminent tightening.
AUD penalized by weak exports and softer tones from the RBA.
Macro differential slightly in favor of EUR.
📊 Intermarket Relative Strength
EUR shows increasing strength against commodity currencies, including AUD. This reinforces the bullish thesis, also confirmed by the capital inflows on the euro.
📰 Real Sentiment and Newsflow
The latest macro news and institutional reports confirm a cautious positioning on the AUD. No imminent driver justifies a structural strengthening of the Australian currency.
🌪 Implied and Historical Volatility
Volatility is growing, but still within optimal historical ranges for sustained directional movements. The current ATR is above the average of the last 10 years, a favorable condition for breakouts.
📆 Macro Event Risk
No disruptive event expected in the next 48 hours. The economic calendar is neutral and does not threaten the technical structure in formation.
📉 Minimum Volatility Threshold
The current range and ATR exceed the minimum values of statistical validity, ensuring that the movement is not a false compression breakout.

EUR/AUD ShortEUR/AUD Short
Minimum entry requirements:
- 1H impulse down below area of interest.
- If tight non-structured 5 min continuation follows, reduced risk entry on the break of it.
- If tight structured 5 min continuation follows, reduced risk entry on the break of it or 5 min risk entry within it.
- If tight non-structured 15 min continuation follows, 5 min risk entry within it if the continuation is structured on the 5 min chart or reduced risk entry on the break of it.
- If tight structured 15 min continuation follows, reduced risk entry on the break of it or 15 min risk entry within it.

EURAUD My Opinion! SELL!
My dear followers,
This is my opinion on the EURAUD next move:
The asset is approaching an important pivot point 1.7858
Bias - Bearish
Safe Stop Loss - 1.7914
Technical Indicators: Supper Trend generates a clear short signal while Pivot Point HL is currently determining the overall Bearish trend of the market.
Goal - 1.7748
About Used Indicators:
For more efficient signals, super-trend is used in combination with other indicators like Pivot Points.
Disclosure: I am part of Trade Nation's Influencer program and receive a monthly fee for using their TradingView charts in my analysis.
———————————
WISH YOU ALL LUCK
EURAUD Bullish TrendThe Weekly and Daily timeframe are bullish.
At 4Hr timeframe, the trend created a higher high and lower high and now heading to a new higher high.
The trend might retrace to the BOS 4H before going long.
Lets keep an eye on it.
Good Luck!

EURAUD Analysis Expecting price preparing to sell off.
I believe price will ultimately attempt another minor bullish push and meet resistance at the supply zone (shaded blue area).
A bearish divergence is currently present, however, I believe it will be confirmed after the failed bullish push.
Looking to short from the supply zone to the 4H zone (pink shaded area)

EURAUD I Monday CLS I Model 1 I Target Weekly HighsHey, Market Warriors, here is another outlook on this instrument
If you’ve been following me, you already know every setup you see is built around a CLS Footprint, a Key Level, Liquidity and a specific execution model.
If you haven't followed me yet, start now.
My trading system is completely mechanical — designed to remove emotions, opinions, and impulsive decisions. No messy diagonal lines. No random drawings. Just clarity, structure, and execution.
🧩 What is CLS?
CLS is real smart money — the combined power of major investment banks and central banks moving over 6.5 trillion dollars a day. Understanding their operations is key to markets.
✅ Understanding the behavior of CLS allows you to position yourself with the giants during the market manipulations — leading to buying lows and selling highs - cleaner entries, clearer exits, and consistent profits.
📍 Model 1
is right after the manipulation of the CLS candle when CIOD occurs, and we are targeting 50% of the CLS range. H4 CLS ranges supported by HTF go straight to the opposing range.
"Adapt what is useful, reject what is useless, and add what is specifically your own."
— David Perk aka Dave FX Hunter ⚔️
👍 Hit like if you find this analysis helpful, and don't hesitate to comment with your opinions, charts or any questions.

EUR/AUD Giving Amazing Bullish P.A , Ready To Get 150 Pips ?Here is my EUR/AUD 2H Chart , if we check the chart we will see that we have a very strong old res that forced the price to respect it may times and finally we have a great breakout and also we have a very good rejection to the area , so it`s the best place to enter a buy trade to go to the high again to see if we can take it also or not . if the price closed below the broken res and new support with daily candle , this mean the idea is not valid anymore .

EUR/AUD BEARS ARE GAINING STRENGTH|SHORT
Hello, Friends!
EUR/AUD is making a bullish rebound on the 12H TF and is nearing the resistance line above while we are generally bearish biased on the pair due to our previous 1W candle analysis, thus making a trend-following short a good option for us with the target being the 1.762 level.
Disclosure: I am part of Trade Nation's Influencer program and receive a monthly fee for using their TradingView charts in my analysis.
✅LIKE AND COMMENT MY IDEAS✅

EA predidtion based on price actionwe have a bulish shift in the weekly TF this is the movement to the weekly NF before proceeding eoth the bullish rally

OANDA:EURAUD Buy SetupThe EURAUD pair is presenting a potential bullish opportunity. After forming a higher low and maintaining bullish structure, price action suggests a continuation to the upside. With favorable risk-to-reward parameters, this setup offers solid potential for intraday or short-term swing traders.
Trade Parameters:
Entry: Market Execution (ensure confirmation on lower timeframes)
Stop Loss: 1.77497
Target Levels:
Take Profit 1: 1.77899
Take Profit 2: 1.78839
As always, manage your risk accordingly and wait for confirmation before entry. Share your thoughts or charts in the comments. If this analysis adds value to your trading, consider hitting boost and following for more setups. Trade safe and stay disciplined!

Bullish EURAUDI was already Buy Bias and Now it is playing out
support level
trend line break
HH formation

EURAUD in Trend ReversalAfter a reversal in the downtrend, I expect the pair to come down and collect the orders before resuming the uptrend.
Buy Limit
Entry Price 1.7700
Stop Loss 1.7642
TP 1.7884
Risk 1%
Lot Size 0.66

A BUY OPPORTUNITY Taking a long position on EURAUD,
Am hoping the pullback to foam the HL is created and entering this postion from the support down to the the new resistance HH

Looking to Buy for EURAUD for this week and next week price rejected daily resistance level and forming a bearing red candle.
The 4H changes structure to confirm the pull back. Since the daily is still bullish, we wait for the 4H time frame to change structure from bearish to bullish!
Price has broken 4H short term trend line, and created a higher high. I always enter at the breakout, but also enter more position if price pulls back lower.
I hope this helps

EURAUD: Bearish Continuation is Highly Probable! Here is Why:
The price of EURAUD will most likely collapse soon enough, due to the supply beginning to exceed demand which we can see by looking at the chart of the pair.
Disclosure: I am part of Trade Nation's Influencer program and receive a monthly fee for using their TradingView charts in my analysis.
❤️ Please, support our work with like & comment! ❤️
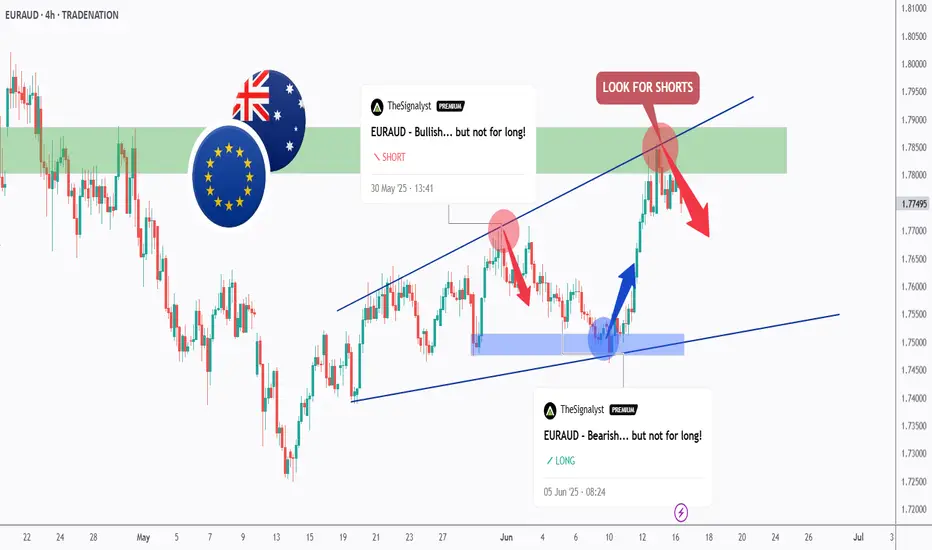
We Are Milking EURAUD... Again!Hello TradingView Family / Fellow Traders. This is Richard, also known as theSignalyst.
As per our two EURAUD analysis, we looked for shorts around the green structure and longs around the blue demand.
What's next?
📈EURAUD has been trading within the rising broadening wedge marked in blue, and it is currently rejecting the upper bound of the wedge which we consider an over-bought zone.
Moreover, the green zone is a strong structure and resistance.
🏹 Thus, the latest highlighted red circle is a strong area to look for sell setups as it is the intersection of the upper blue trendline and resistance.
📚 As per my trading style:
As #EURAUD is around the red circle zone, I will be looking for bearish reversal setups (like a double top pattern, trendline break , and so on...)
📚 Always follow your trading plan regarding entry, risk management, and trade management.
Good luck!
All Strategies Are Good; If Managed Properly!
~Rich
Disclosure: I am part of Trade Nation's Influencer program and receive a monthly fee for using their TradingView charts in my analysis.
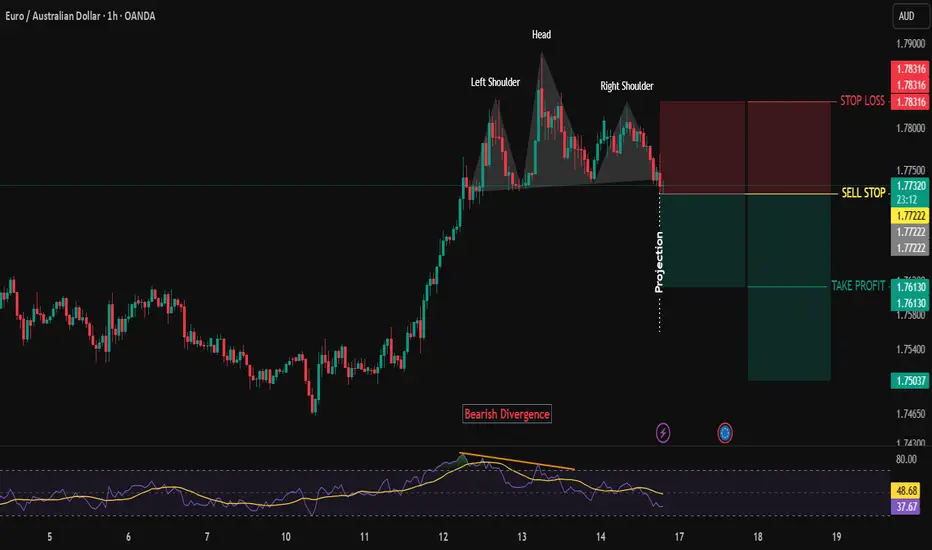
EURAUD BEARISH SETUPEURAUD head and shoulder pattern formed which indicates the chances of reversal with bearish divergence formed.
Place sell stop order with stop loss of previous LH.
Manage your trade accordingly.
EURAUD Bearish Channel Breakdown Imminent – Watch Retest to SellEURAUD is trading within a well-defined descending channel on the 15-minute timeframe. Price recently tested the upper boundary of the channel and is now expected to continue lower towards the 1.74979 target area.
A potential breakout below the channel support may trigger further downside movement. Wait for a proper retest confirmation before entering any short position. The overall bias remains bearish until the price breaks above the channel resistance.
Risk management is essential as false breakouts are possible. Watch for price action signals near the lower boundary and target zone.
