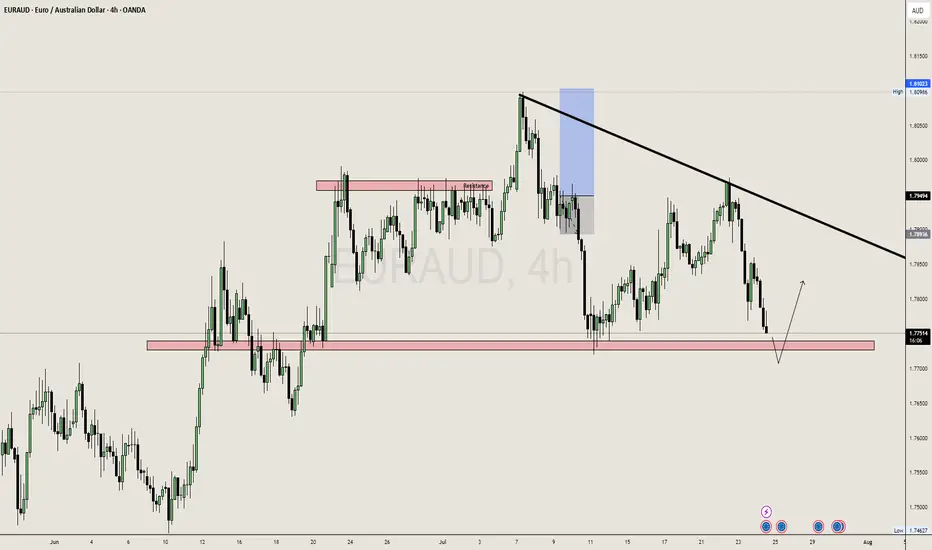
EURAUD 4H: Long Setup from Fresh Demand ZoneOverview:
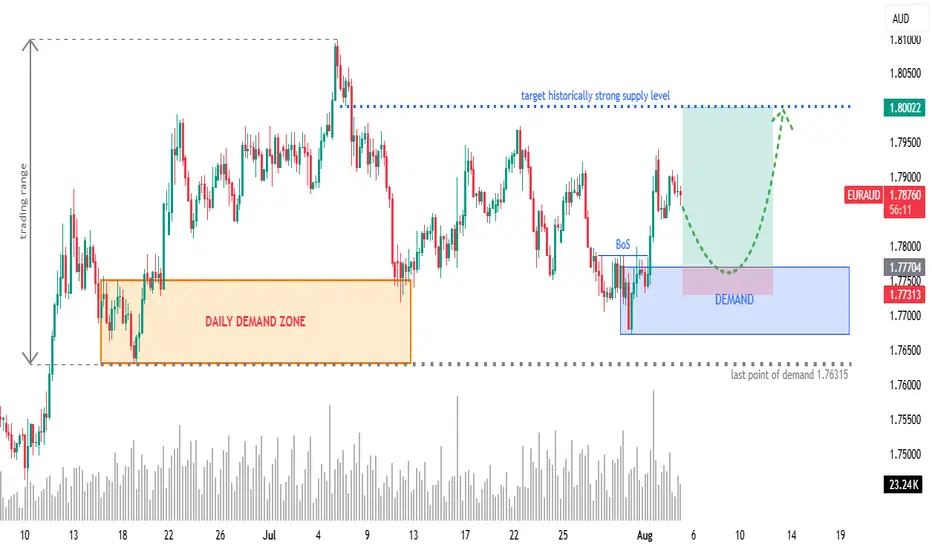
OANDA:EURAUD retracing into a newly formed 4H demand zone after a bullish Break of Structure (BoS). Eyes on continuation towards a historically significant supply zone at 1.8000.
🧩 Setup Details
• Asset & Timeframe: EURAUD, 4H
• Bias: Bullish
• Entry Zone: 1.77300 – 1.77700 (DEMAND area)
• Targets:
🎯 T1 = 1.7900 (minor reaction level)
🎯 T2 = 1.8000 (historical supply level)
• Stop-Loss: Below 1.77300 (last valid demand)
• Risk-Reward: Approx. 1:6+
🧠 Why Now? (Trade Rationale)
• ✅ Fresh 4H Demand Zone: Price is retracing into a clear demand zone after rejecting lower prices.
• ✅ Break of Structure (BoS): Bullish BoS confirms shift in order flow.
• ✅ Volume Confirmation: Increasing demand near current price levels.
• ✅ Clear Liquidity Sweep: Price likely swept short-term lows before BoS.
• ✅ Target Supply Zone: 1.8000 is a well-respected historical supply/resistance level — clean magnet for price.
⏱ Multi-Timeframe Context
• Daily Chart: Price is reacting off a larger DAILY DEMAND ZONE. Trend bias is bullish.
• 4H Chart: Structure break + demand formation suggest continuation.
• 1H/Entry Level: Monitor price action in the blue zone for lower-timeframe confirmation (e.g. bullish engulfing, flip zones, LQ sweep, etc.) and potentially greater risk-reward.
📉 Risk Management & Duration
• Stop below 1.76315 keeps you protected from deeper invalidation.
• Trade Duration: Short to mid-term (1–4 days).
• Position Size: Scale based on volatility; ideal for swing trade conditions.
📌 Trade Plan Summary
📍 Watch for bullish PA on re-entry into demand (1.77300–1.77700)
📍 Set SL below 1.76315
📍 TP1 at 1.79000 — partials advised
📍 TP2 at 1.80000 — strong historical level
📍 Adjust SL to BE on momentum breakout
AUDEUR trade ideas
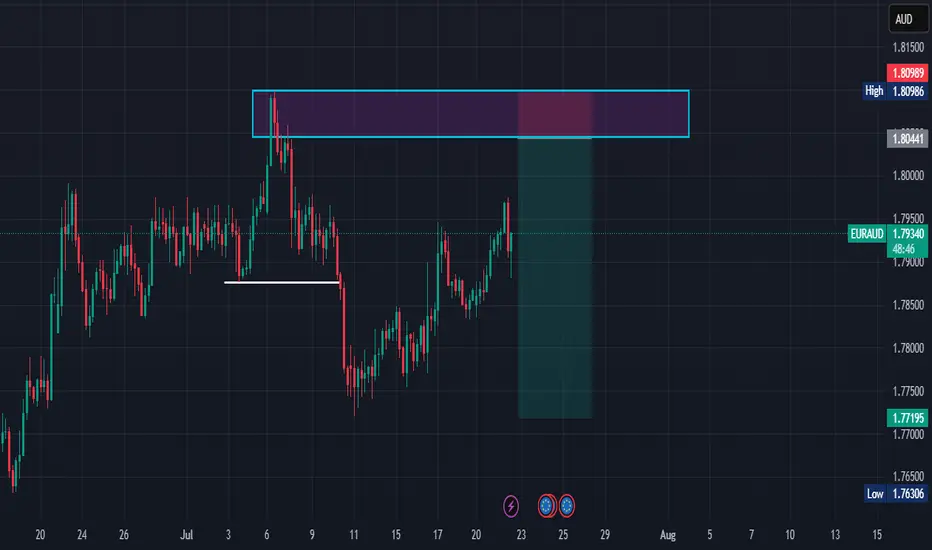
One Sweet Bullish Candle Above 50EMA… and I’m All Yours, 1.7940I’ve got a lovely 1H bullish range from 1.7733 to 1.7940 — pure potential.
Market gave me a 100-pip pullback/retracement from 1.7940 to 1.7840 — just a little mood swing. 😒
Now I’m patiently stalking...
If a bullish candle closes above my 50EMA,
I’m not thinking twice — I’m riding the bull! 🐂💥
SL? Depends on the candle’s vibe:
If it’s a strong Marubozu, I’ll trust it like a loyal partner — SL goes just below it.
TP? Straight to 1.7940 — no detours, no drama. 🎯
Wish me luck… and a Marubozu with commitment issues! 😂📉📈

Lower Timeframe Analysis on EUR/AUDWhen analyzing the pair on lower timeframes, there appears to be a potential opportunity for a long position.
Looking at the broader picture on the daily timeframe, the pair may continue its upward movement following the formation of a strong bullish candle on Friday (August 1st, 2025).
Additionally, it's worth noting that the pair recently reached a low around 1.72476 and may now be aiming to establish a new high near 1.85566.
Given that this analysis is based on the daily timeframe, and following the breakout of the resistance at 1.79311 — which corresponds to the upper boundary of a rectangle marking the current range — a long position is considered valid.
Note: Be mindful of the potential for a GAP at the market open.
It is essential to remember that while technical analysis can provide valuable signals, it is crucial to also monitor economic data, news releases, and other fundamental factors that may affect this pair. This analysis focuses solely on the technical aspect.
The long position tool shown on the chart is meant for illustrative purposes only and should not be considered a definitive entry signal.
Disclaimer: This analysis reflects only my personal view of the market and does not, under any circumstances, constitute investment advice.

The 7 Secrets Of Trading MasteryIn this video we are going to talk about:
Buy Limit Orders
Sell Limit Orders
Reversal Patterns
Double Tops
Double Bottoms
Using The Rocket Booster Strategy
The Power Of Risk Management
Watch this video on CAPITALCOM:EURAUD in order for you to learn more
take care and trade safe.
Rocket Boost This Content To Learn More
Disclaimer;Trading is risky please a simulation ion trading account
before you trade with real money
also learn risk management and profit taking strategies.

EURAUD BULLISH MOVE CONTINUESOur analysis is based on a multi-timeframe top-down approach and fundamental analysis.
Based on our assessment, the price is expected to return to the monthly level.
DISCLAIMER: This analysis may change at any time without notice and is solely intended to assist traders in making independent investment decisions. Please note that this is a prediction, and I have no obligation to act on it, nor should you.
Please support our analysis with a boost or comment!

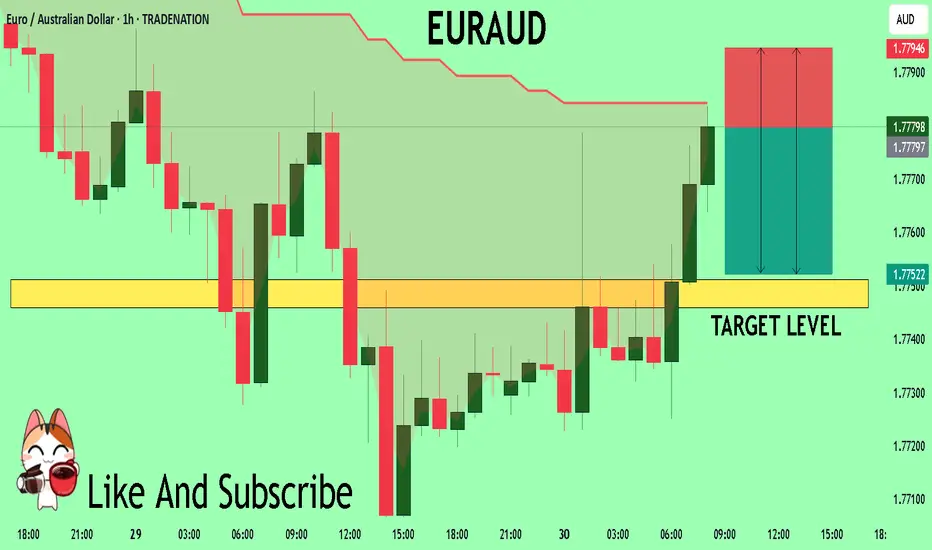
EUR-AUD Bullish Breakout! Buy!
Hello,Traders!
EUR-AUD made a bullish
Breakout of the falling resistance
And the breakout is confirmed
So we are bullish biased
And we will be expecting
A further bullish move up
On Monday!
Buy!
Comment and subscribe to help us grow!
Check out other forecasts below too!
Disclosure: I am part of Trade Nation's Influencer program and receive a monthly fee for using their TradingView charts in my analysis.

EUR/AUD LongLike the long off the bottom the range for a bounce back up off the 1.77250 area to maybe first area of 1.78900 and full take profit of 1.79700
FX:EURAUD

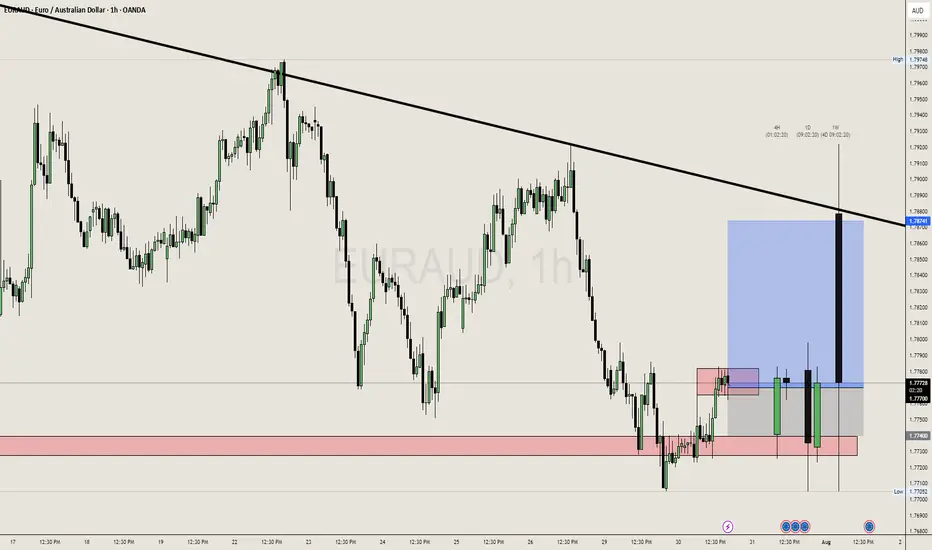
EURAUD waiting for breakoutWe can see a breakout in upside in EURUAD after this consolidation as EA already tested it's support and swept the sell side liquidity. Targeting 1.78500 Zone Again for Testing and also forming a triangle pattern in 4H.
We can take a buy till that trend line test with tight SL.
EURAUD Long TradeOANDA:EURAUD Long trade, with my back testing of this strategy, it hits multiple possible take profits, manage your position accordingly.
TP-1 is high probability.
This is good trade, don't overload your risk like greedy, be disciplined trader, this is good trade.
Use proper risk management
Looks like good trade.
Lets monitor.
Use proper risk management.
Disclaimer: only idea, not advice

EURAUD Under Pressure! SELL!
My dear followers,
I analysed this chart on EURAUD and concluded the following:
The market is trading on 1.7780 pivot level.
Bias - Bearish
Technical Indicators: Both Super Trend & Pivot HL indicate a highly probable Bearish continuation.
Target - 1.7751
Safe Stop Loss - 1.7794
About Used Indicators:
A super-trend indicator is plotted on either above or below the closing price to signal a buy or sell. The indicator changes color, based on whether or not you should be buying. If the super-trend indicator moves below the closing price, the indicator turns green, and it signals an entry point or points to buy.
Disclosure: I am part of Trade Nation's Influencer program and receive a monthly fee for using their TradingView charts in my analysis.
———————————
WISH YOU ALL LUCK
EURAUD Long - Pullback from Monthly Support - Easy MoneyOANDA:EURAUD Long Trade.
EURUSD is Bouncing Back from Monthly Support.
Note: Manage your risk yourself, its risky trade, see how much your can risk yourself on this trade.
Don't be greedy.
Use proper risk management
Looks like good trade.
Lets monitor.
Use proper risk management.
Disclaimer: only idea, not advice

Understanding Market StructureYou can follow us for more Analysis(Images and Videos) with Precise definition of the Financial Market.ENJOY!!!


EUR/AUD: Triangle Breakout Opportunity^EURAUD is currently trading at 1.7878, forming a well-defined symmetrical triangle pattern after a strong uptrend that began in early 2023. The pair has maintained a bullish structure with higher lows along a clear trendline since mid-2022, culminating in a powerful breakout in March 2025.
Technical Analysis
Triangle Formation: Since April 2025, price has consolidated in a symmetrical triangle, with converging trendlines indicating compression before the next directional move.
Support Zone: The 1.77 area has proven to be reliable support throughout June-July 2025, with multiple successful tests.
Resistance Level: The 1.80 level has capped upward movement since April, creating the upper boundary of our triangle pattern.
Momentum Indicators: The recent higher lows suggest underlying bullish pressure building within the triangle formation.
Trading Strategy
Given the overall uptrend and triangle formation, this setup offers a compelling trading opportunity:
Bullish Trade Setup
Entry: Buy at current market price (1.7878) or on a pullback to 1.7780
Stop Loss: Place below the triangle support at 1.7680
First Target: 1.8050 (triangle resistance)
Second Target: 1.8300 (measured move from triangle height)
Risk-Reward: Approximately 1:2.5 for the full move
Alternative Approach
Breakout Entry: Buy on a break above 1.8000 with a stop below 1.7780
Breakout Target: 1.8300-1.8400
Rationale
The symmetrical triangle forming at the upper range of a strong uptrend typically resolves in the direction of the prevailing trend. With ^EURAUD showing resilience at support levels and maintaining its position above the long-term trendline, the probability favors an upside resolution.
The March 2025 breakout demonstrated significant bullish momentum, and the current consolidation appears to be a pause rather than a reversal. The multiple tests of support at 1.77 without breaking lower further strengthens the bullish case.
Key Levels to Watch
Breakout Confirmation: Daily close above 1.8000
Support Breakdown Alert: Daily close below 1.7700
Major Support: Long-term trendline around 1.7000
Upside Potential: Previous high at 1.8550 (April 2025)
^EURAUD presents a classic triangle consolidation within an uptrend, offering a favorable risk-reward opportunity. The technical structure suggests accumulation rather than distribution, with price likely to resolve higher in alignment with the longer-term bullish trend.
Traders should monitor the 1.80 resistance level closely, as a decisive break above this level could trigger a significant move higher, potentially targeting the April 2025 highs.

EURAUD Approaching SupportWe can expect a buy side move from the support till the trend line.
EA is Sideways in Daily we can plan the buy till the resistance zone/ trend line.
Euraud buy now Euraud has bounced off major support zones and has now broken structure resistance so I will be buying at 1.78600 and take profit at 1.79724 a 0.63% rise makes good profit on cfd also

EUR/AUD BUYERS WILL DOMINATE THE MARKET|LONG
EUR/AUD SIGNAL
Trade Direction: long
Entry Level: 1.787
Target Level: 1.791
Stop Loss: 1.785
RISK PROFILE
Risk level: medium
Suggested risk: 1%
Timeframe: 1h
Disclosure: I am part of Trade Nation's Influencer program and receive a monthly fee for using their TradingView charts in my analysis.
✅LIKE AND COMMENT MY IDEAS✅

EURAUD Mixed MoodEUR market is currently super bullish, however a bearish flag hinders further buys. We await the bearish flag to complete before we place buy positions.

EURAUD Short IdeaPrice is currently correcting and may possibly make a bearish move. Still, needs a confirmatory entry at lower time frame as this is a daily time frame set-up.

EURUAD is in the Buy directionHello Traders
In This Chart EUR/AUD 4 HOURLY Forex Forecast By FOREX PLANET
today EUR/AUD analysis 👆
🟢This Chart includes_ (EUR/AUD market update)
🟢What is The Next Opportunity on EUR/AUD Market
🟢how to Enter to the Valid Entry With Assurance Profit
This CHART is For Trader's that Want to Improve Their Technical Analysis Skills and Their Trading By Understanding How To Analyze The Market Using Multiple Timeframes and Understanding The Bigger Picture on the Charts

EURAUD Bearish Possible Move.Price on weekly signifies a possible sell move, with an engulfing pattern. Daily formed a supply zone, signifying a possible bearish move. Price retracing to the 4hr supply zone for possible entry.
Remember: Risk Management very important.