EURAUD Wave Analysis – 3 March 2025
- EURAUD broke key resistance level 1.6770
- Likely to rise to resistance level 1.6900
EURAUD currency pair today broke sharply above the key resistance level 1.6770, which stopped the earlier waves (2) and 2, as can be seen below.
The breakout of the resistance level 1.6770 accelerated the active short-term correction ii of the higher order impulse wave 3 from the start of February.
EURAUD currency pair can be expected to rise to the next resistance level 1.6900 (which reversed the price sharply at the start of August).
AUDEUR trade ideas

EUR-AUD Bullish Breakout! Buy!
Hello,Traders!
EUR-AUD is trading in an
Uptrend and the pair made
A bullish breakout of the
Key horizontal level of 1.6777
And the breakout is confirmed
So we will be expecting a
Further bullish move up
Buy!
Comment and subscribe to help us grow!
Check out other forecasts below too!

EURAUD I Consider This Before Shorting Welcome back! Let me know your thoughts in the comments!
** EURAUD Analysis - Listen to video!
We recommend that you keep this pair on your watchlist and enter when the entry criteria of your strategy is met.
Please support this idea with a LIKE and COMMENT if you find it useful and Click "Follow" on our profile if you'd like these trade ideas delivered straight to your email in the future.
Thanks for your continued support!Welcome back! Let me know your thoughts in the comments!

EURAUD Sell IdeaFollowing a careful examination of trend exhaustion and RSI levels, Uncle Jake provided thoughtful counsel and suggested considering various factors before making a Sell decision.

EURAUDWe have CHOCH thats main the price change from downtrend to uptrend, and as we see we have strong zone to take long
LR

EurAud is bearishwhile we were expecting the pair went upward ,we observed that a reversal pattern made and price started heading south .
double top pattern as reversal one and head and shoulder as continuation pattern is depicted on the chart
let's see what would happen


EUR/AUDOn Daily,
we notice Lower-High one after the other, and threee on the row. This Friday, it made a Spinning Top Doji which is a Bearish Candle. It also, Making Lower-Low sharper than Higher-Low.
On 1H,
It has made a inverted "V" reversal with a presize neck. If the neck breaks, and confirmed, then Bearish move is the game.

EURAUD at Key decision point, The Week Ahead 03rd March '25The EURAUD currency pair remains in a neutral stance within a longer-term consolidation phase, reflecting indecisive market sentiment. Recent price action has seen an oversold rebound toward a key resistance level, which may define the next directional move.
Key Levels to Watch
Resistance Levels: 1.6740, 1.6812, 1.6950
Support Levels: 1.6517, 1.6400, 1.6350
Bullish Scenario
A decisive breakout above the 1.6740 resistance level, confirmed by a daily close, could invalidate the current bearish outlook. Such a move would indicate bullish momentum, with potential upside targets at 1.68120, followed by 1.695 in the medium term.
Bearish Scenario
Conversely, if 1.6740 acts as a firm resistance and price faces rejection, a downside move could unfold. A sustained decline below 1.6517 may accelerate bearish momentum, targeting 1.6400 (200 DMA) and eventually 1.6350 over the longer term.
Conclusion
EURAUD is currently at a key decision point, with price action around the 1.6740 resistance likely to determine the next directional bias. A breakout higher could open further upside potential, while a rejection from this level may reinforce bearish pressure. Traders should remain cautious and wait for confirmation before positioning for either scenario.
This communication is for informational purposes only and should not be viewed as any form of recommendation as to a particular course of action or as investment advice. It is not intended as an offer or solicitation for the purchase or sale of any financial instrument or as an official confirmation of any transaction. Opinions, estimates and assumptions expressed herein are made as of the date of this communication and are subject to change without notice. This communication has been prepared based upon information, including market prices, data and other information, believed to be reliable; however, Trade Nation does not warrant its completeness or accuracy. All market prices and market data contained in or attached to this communication are indicative and subject to change without notice.

EURAUD REVERSAL PATTERN SPOTTED!Price has formed a double button reversal patter in the daily timeframe. This shows there could be a possibility of buyers to continue pushing the price higher. We have alot of economic indicators/news coming up next week. We’d be expecting High volatility in prices. If we’d get a retest to the neckline price of 1.66308. We’d be going long


EUR_AUD RESISTANCE AHEAD|SHORT|
✅EUR_AUD is going up now
But a strong resistance level is ahead of 1.6800
Thus I am expecting a pullback
And a move down towards the target of 1.6700
SHORT🔥
✅Like and subscribe to never miss a new idea!✅

EURAUD at Key Resistance Zone – Will Sellers Step In?OANDA:EURAUD has reached a significant resistance zone, marked by prior price rejections, suggesting strong selling interest. This area has previously acted as a key supply zone, increasing the likelihood of a bearish reversal if sellers regain control.
If the price confirms resistance within this zone through bearish price action (e.g., wicks or rejection candles), we could see a move toward 1.66260, which aligns with a logical target based on recent structure.
However, if the price breaks and holds above this resistance area, the bearish outlook may be invalidated, potentially opening the door for further upside.
Just my take on support and resistance zones—not financial advice. Always confirm your setups and trade with solid risk management.
Best of luck!

EUR/AUD: Strong Support and Buyers InterestEUR/AUD has found a strong support level and is currently showing signs of increased buyer interest, suggesting a possible reversal in the price movement. This interest from buyers indicates that there may be a good opportunity for the price to rise. However, there is a bearish trend line acting as resistance that could create a challenge for any upward movement.
If the price can break through this bearish trend line, it would signal strong momentum from buyers and could lead to upward trend. Alternatively, if the price struggles to break this resistance, it may continue to face downward pressure and remain within the bearish trend.

EURAD - Analysis and Potential Setups (Intraday- 26.02.25)Overall Trend & Context:
This pair is in an overall uptrend since last week.
Technical Findings:
Price is trading above 25, 50,100 and 200 EMA's on the daily chart.
Bullish price action is evident during London, we may see manipulation during NY (keep an eye out on the LTF demand levels).
Notes:
Relatively aggressive entry considering we're currently trading at a HTF supply zone, so make sure to manage your risk accordingly.
Sorry for being MIA for a minute!
I'm still here and the setups will continue to come.
Happy Hunting Predators!
Apex Out!

EURAUD Bullish Breakout!
HI,Traders !
EUR-AUD was trading
Beneath the falling resistance
Line but now we are seeing a
Bullish breakout so we are
Now locally bullish biased
And we will be expecting a
Further bullish move up !
Comment and subscribe to help us grow !

17-02-2025 _ Short Term Bearish Idea _ EURAUD D11. Double Top
2. Bearish Divergence.
3. Convergence.
4. Pullback has happened.
5. One can expect further continuation to the downside.

EURAUD (Bearish) has been reach to Strong resentence level What has been done will be done again there is nothing new under the sun ☀️ (W.D.G)
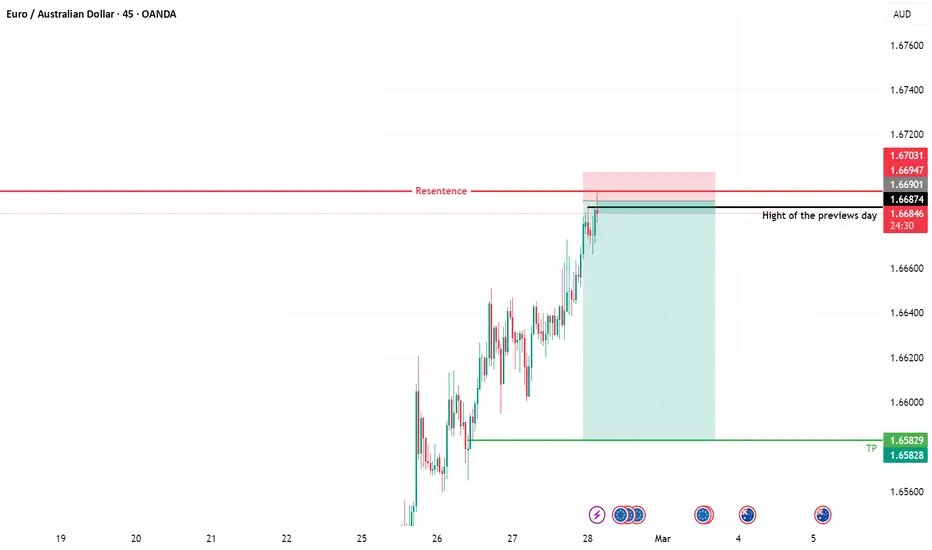
EURAUD Possible SellEURAUD possible sell after the price pullback up to the 38.2 fib level and close blow the red strong resistance level .
Good LUck

euraud sell signal. Don't forget about stop-loss.
Write in the comments all your questions and instruments analysis of which you want to see.
Friends, push the like button, write a comment, and share with your mates - that would be the best THANK YOU.
P.S. I personally will open entry if the price will show it according to my strategy.
Always make your analysis before a trade

DON'T MISS EURAUD SHORT TRADE📌 Trade Setup Details:
Pair: EUR/AUD
Timeframe: 4H (4-Hour)
Entry: 1.66347 (Sell Entry after Liquidity Grab)
Stop-Loss (SL): 1.66587 (Above Sell-Side Liquidity Level)
Take Profit (TP):
TP1: 1.65000 (Fair Value Gap - FVG)
TP2: 1.64808 (Order Block - OB)
TP3: 1.64309 (Major Sell-Side Liquidity Target)
Risk-to-Reward (RR): Around 1:4
📊 Market Analysis & Justification:
Liquidity Grab: Price swept previous highs, indicating a potential reversal.
Order Block Confirmation: Rejection near the 4H OB confirms a possible sell setup.
FVG (Fair Value Gap): An imbalance below suggests price is likely to fill this zone.
Market Structure: After liquidity grab and rejection, we expect lower lows in the market.
This trade setup follows Smart Money Concept (SMC) and ICT principles, aligning with bearish price action. 📉🔥

EURAUD EURAUD AT 1.663 was a supply roof on multiple intraday close roof on (1hr,2hr,3hr,4hr and the sell pressure respected the intraday time frame trade alignment .

EURAUD Massive Long! BUY!
My dear friends,
EURAUD looks like it will make a good move, and here are the details:
The market is trading on 1.6425 pivot level.
Bias - Bullish
Technical Indicators: Supper Trend generates a clear long signal while Pivot Point HL is currently determining the overall Bullish trend of the market.
Goal - 1.6503
About Used Indicators:
Pivot points are a great way to identify areas of support and resistance, but they work best when combined with other kinds of technical analysis
———————————
WISH YOU ALL LUCK
