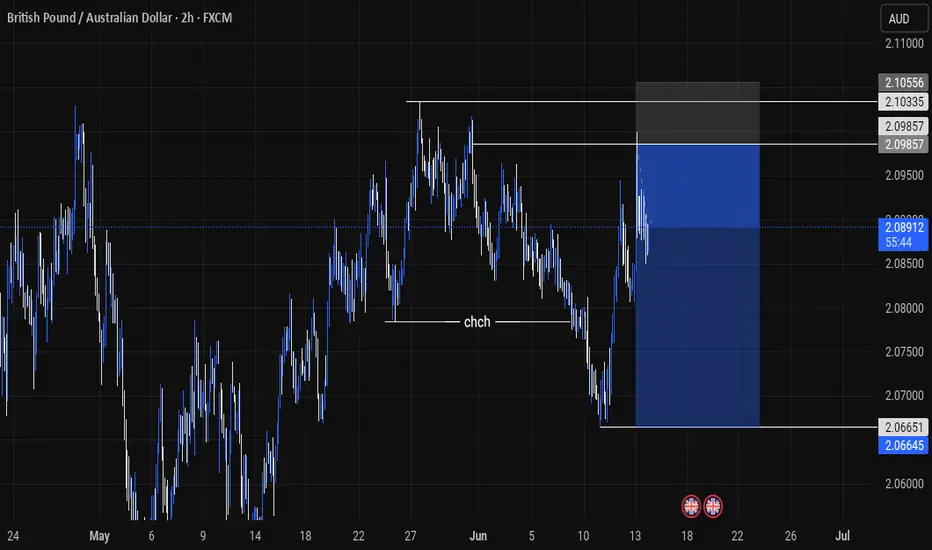
GBPAUD 15/06/2025Weekly:
-Bullish M pattern.
-Inverse H&S pattern.
-IC.
Daily:
-Inverse H&S pattern.
4H:
-Bullish M pattern.
AUDGBP trade ideas

Gbpaud buysGbp following the higher timeframe we will definitely continue on buys, based on sma it will continue to push upward

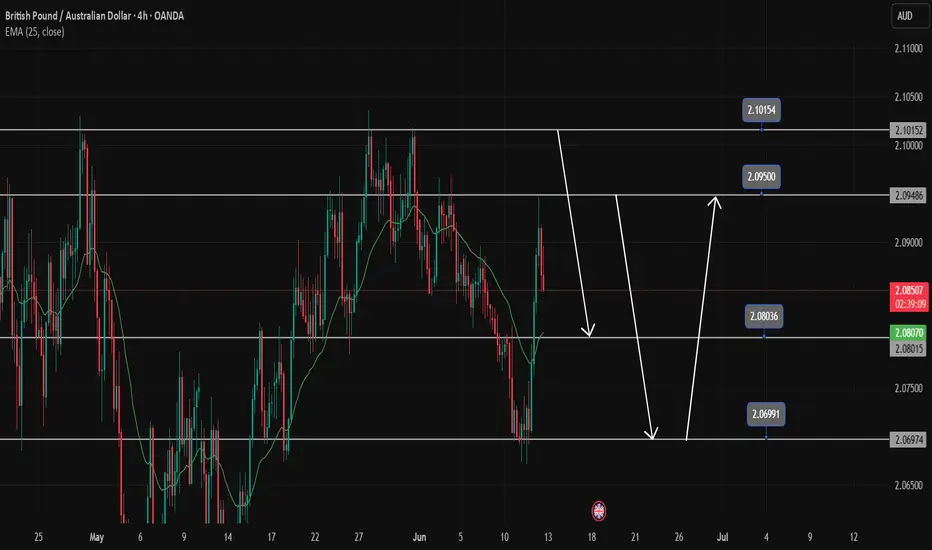
GBPAUD BearishUpon examining the daily chart for GBPAUD, the outlook appears to be bearish, bolstered by the presence of bearish butterfly harmonics that affirm this trend. As I assess the market conditions for the coming week, I am contemplating entering a short position.
For this trade, I am setting my take-profit levels as follows:
- TP1 at 2.06
- TP2 at 2.05
- TP3 at 2.03
To manage risk, I will place my stop-loss at 2.11. This strategy aims to capitalize on the anticipated downward movement while safeguarding against potential reversals.

Bullish Potential for GBPAUDPotential Formation for H&S pattern on the Daily time Frame
Waiting to break the AOI @ 2.100,to go long

GBP/AUD Trade Setup: Bullish Outlook Aligned with Fundamentals
📊 Market Insight: How Base Currencies Drive the Market
One key lesson I’ve learned from my mentor is this:
When a base currency is trending, it often pulls the entire forex market with it.
For example:
When the Dollar Index (DXY) is trending, the whole forex market tends to move with momentum.
When the DXY is ranging, the entire forex market often consolidates or lacks clear direction.
The same applies to EURUSD, another major pair. If EURUSD is trending, the whole market tends to trend. If it’s ranging, most of the market reflects that indecision.
This happens because the USD and EUR are two of the most influential currencies in global markets — they affect risk sentiment, liquidity, and overall volatility.
---
🔍 GBP/AUD Analysis: The Power of Multi-Timeframe Perspective
This week, I was analyzing GBP/AUD. My initial bias was bearish — I saw what looked like a clear drop and assumed the pair was falling.
But I made a common mistake:
I was zoomed in too closely, focused only on the lower timeframe structure.
When I finally zoomed out to view the higher timeframes, I saw a different story:
The market was not actually falling.
What looked like a downtrend was just a retracement.
It was a liquidity grab, tapping into demand zones and trendline support before continuing upward.
This shift gave me clarity:
GBP/AUD is still in a bullish trend and what I was seeing was just a setup for the next move higher.
---
🌍 Fundamental Bias: USD Weakness, GBP Strength
Looking across the market:
The Dollar Index is falling, signaling USD weakness.
As a result, pairs like EURUSD and GBP/USD are rising.
This tells me that GBP is currently strong, especially against weaker currencies like AUD.
So, with GBP/USD trending bullish, it supports the idea that GBP/AUD will also rise, given GBP strength and AUD relative weakness.
---
✅ Trading Plan for the Week Ahead
I use the weekend to prepare for the upcoming trading week by aligning my technical setups with fundamental bias.
Current status:
✅ All technical confirmations are in place.
✅ My bias for GBP/AUD is bullish.
🕒 I’m waiting for the Monday open to see where price begins to trade from.
📉 Then I’ll drop to the lower timeframes (M15–H1) to find my entry.
My targets are:
🎯 Target 1: Marked by the blue line on my chart
🎯 Target 2: Marked by the red line
🎯 Target 3: Higher up, beyond visible chart range due to screen limitations
💡 Final Takeaway
This experience reinforces the importance of:
Multi-timeframe analysis
Zooming out to see the bigger picture
Aligning technical setups with fundamental trends
It’s not just about what the chart shows in the moment — it’s about the broader context driving the market.

GBPAUD: A SHORT TRADE IDEAOANDA:GBPAUD I'm selling at the current market price with my target at the 2.07139 price level.

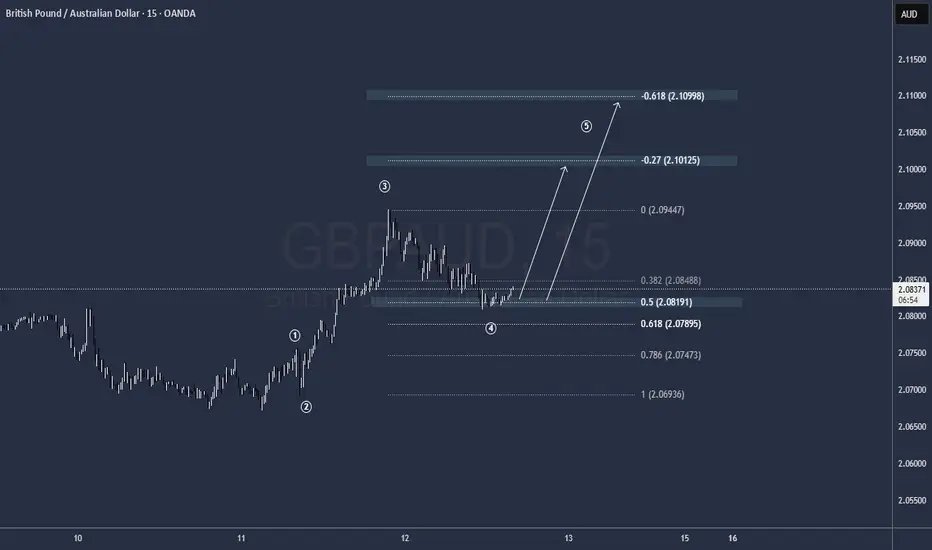
GBPAUD - Bullish BIAS Bullish Indications:
1- Market Broke the LH and formed 1st HH
2- Market Broke the trend line resistance
3- Bullish Divergence on 4H time Frame
Entry Plan:
Waiting for the market to retrace to the 38% of Fib Level
which Coincides with the Trend Line Support and Support Level

GBPAUD TRADEon gbpaud, the market has taken off to the downside. there was a break of structure or a new lower low to the downside.We got a pull back to fibonacci level and our trade was executed to the downnside
GBPAUD Trading SignalsGBPAUD is reacting at the resistance zone with this force, the downtrend will continue at 2.08000. If you want to BUY at 2.0800, you have to wait for the price reaction of the candle. If you break 2.080, you have to wait at 2.06900 for BUY strategies. In the opposite direction, the peak of 2.101 is still an important peak where you can execute the SELL strategy with the GBPAUD currency pair.
GBP/AUD BEARISH BIAS RIGHT NOW| SHORT
Hello, Friends!
We are now examining the GBP/AUD pair and we can see that the pair is going up locally while also being in a uptrend on the 1W TF. But there is also a powerful signal from the BB upper band being nearby, indicating that the pair is overbought so we can go short from the resistance line above and a target at 2.078 level.
Disclosure: I am part of Trade Nation's Influencer program and receive a monthly fee for using their TradingView charts in my analysis.
✅LIKE AND COMMENT MY IDEAS✅

GBPAUDTechnical View:
GBP/AUD recently rejected resistance and is testing support around 2.0290.
Price action suggests further downside if support breaks
Bias: 📉 Short

GBPAUD: I'M GOING LONG!!!I'm going long here at the current market price, I'll take profits at the 2.09685 price level while having my stop at 2.06586


Long GBPAUDGBPAUD testing a demand zone, long initiated at 2.07050, stops below 2.06687. Targeting 2.07790 handle to cover the long.
Demand zone on both 1h and 4h.

GBPAUD to find sellers at current market price?GBPAUD - 24h expiry
The medium term bias remains bearish.
The sequence for trading is lower lows and highs.
Bullish divergence is expected to support prices.
Preferred trade is to sell into rallies.
Bespoke resistance is located at 2.0810.
We look to Sell at 2.0830 (stop at 2.0860)
Our profit targets will be 2.0710 and 2.0670
Resistance: 2.0790 / 2.0820 / 2.0880
Support: 2.0670 / 2.0630 / 2.0580
Risk Disclaimer
The trade ideas beyond this page are for informational purposes only and do not constitute investment advice or a solicitation to trade. This information is provided by Signal Centre, a third-party unaffiliated with OANDA, and is intended for general circulation only. OANDA does not guarantee the accuracy of this information and assumes no responsibilities for the information provided by the third party. The information does not take into account the specific investment objectives, financial situation, or particular needs of any particular person. You should take into account your specific investment objectives, financial situation, and particular needs before making a commitment to trade, including seeking advice from an independent financial adviser regarding the suitability of the investment, under a separate engagement, as you deem fit.
You accept that you assume all risks in independently viewing the contents and selecting a chosen strategy.
Where the research is distributed in Singapore to a person who is not an Accredited Investor, Expert Investor or an Institutional Investor, Oanda Asia Pacific Pte Ltd (“OAP“) accepts legal responsibility for the contents of the report to such persons only to the extent required by law. Singapore customers should contact OAP at 6579 8289 for matters arising from, or in connection with, the information/research distributed.

A FINE BUY SETUP ON GBPAUDPrice has returned to a failed block it violated recently, it has created a higher high after taking out the previous high which signifies the trend continuation. I'll align my bias with this and long the pair.

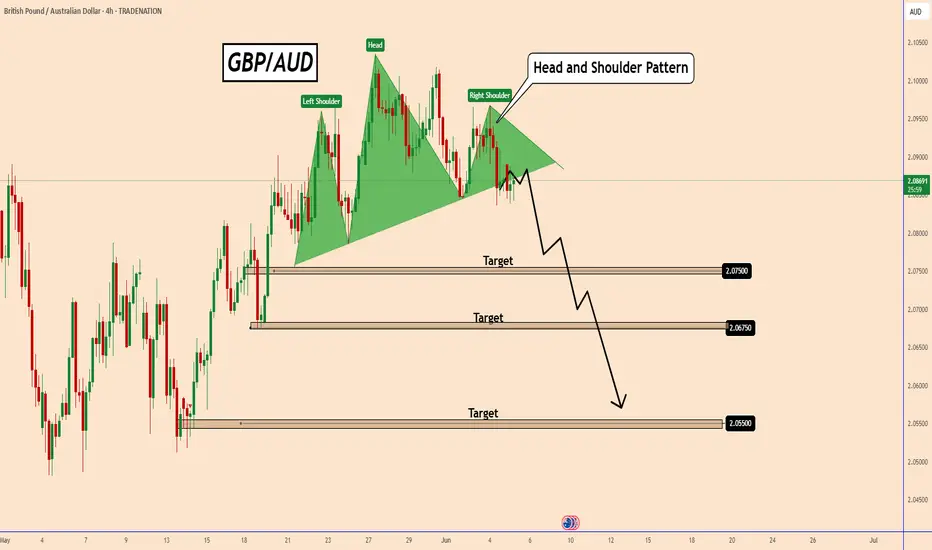
GBPAUD: Potential Head and Shoulders PatternGBPAUD: Potential Head and Shoulders Pattern
GBPAUD is showing a possible Head and Shoulders pattern on the 4-hour timeframe. The pattern suggests a possible trend reversal and a decline in GBP.
The pattern is almost complete, but this week has very low volume and could develop further.
Once the price breaks below the neckline of the pattern, a further decline should occur.
The main targets I am watching:
2.07500; 2.06750 and 2.05500
If the pattern develops as expected, GBPAUD could gradually decline towards the stated targets. However, the strength of this move will depend on market volume and conditions, as well as fundamental factors such as US tariffs or UK economic data.
You may find more details in the chart!
Thank you and Good Luck!
❤️PS: Please support with a like or comment if you find this analysis useful for your trading day❤️
Disclosure: I am part of Trade Nation's Influencer program and receive a monthly fee for using their TradingView charts in my analysis.
GA ideal plan Just a trade idea and not signal. I have shared my view would be lovely to get counter, diff bias / same bias

Did You Catch the Sweep & Shift on GBPAUD?Sometimes the market whispers its intentions before making a move — and this was one of those moments. This GBPAUD setup was built on the core principles of Candle Range Theory (CRT):
Sweep of the Previous Day’s Low (PDL)
Break of Structure (BOS) confirming a shift in momentum
Entry retracement into the Fair Value Gap (FVG)
What stood out here was the precision of the sweep and how price reacted cleanly after BOS, tapping into the FVG zone and immediately pushing toward the high-probability target.
No indicators, no noise, just clean market structure and smart money behavior.
The temptation to enter early was real, but the edge came from waiting for price to validate itself. A textbook example of how patience and plan adherence outweigh prediction .

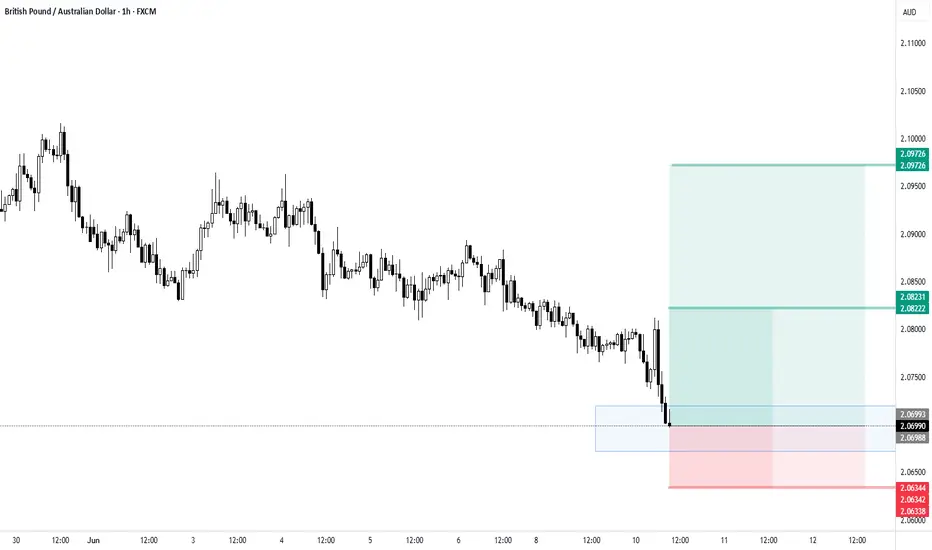
GBPAUD: Bullish Continuation & Long Trade
GBPAUD
- Classic bullish setup
- Our team expects bullish continuation
SUGGESTED TRADE:
Swing Trade
Long GBPAUD
Entry Point - 2.0740
Stop Loss - 2.0699
Take Profit - 2.0833
Our Risk - 1%
Start protection of your profits from lower levels
Disclosure: I am part of Trade Nation's Influencer program and receive a monthly fee for using their TradingView charts in my analysis.
❤️ Please, support our work with like & comment! ❤️

GA LongAfter a significant downtrend, price action on GBPAUD reached a key demand zone where buy-side interest has historically been strong. The pair broke below a previous support level but quickly recovered, suggesting a possible liquidity grab. This aligns with the wick rejection seen under the daily support, indicating strong bullish intent.
A descending trendline was also broken, confirming a potential reversal or at least a short-term correction. With price now consolidating above this zone and early bullish structure forming on the lower timeframes, the conditions support a long setup.
Entry Details:
• Entry Price: ~1.8346
• Stop Loss: ~1.8281 (65 pips)
• Target: ~1.8655 (309.5 pips)
• Risk/Reward Ratio: ~5.6:1
Key Zones:
• Support Zone: Demand area previously tested
• Resistance/Target Zone: Aligned with previous market structure and clean inefficiency above
Conclusion:
This trade is based on a potential shift in market sentiment following a false break of daily structure. The risk/reward is highly favorable, and the trade offers a good opportunity for trend reversal or corrective rally. All parameters are set based on a clearly defined technical setup.
