GBPAUD Sell Setup- Go for sell only when entry setup given
- Refine entry with smaller SL for better RR, if you know how
- keep looking for sell even if price goes one more up
A Message To Traders:
I’ll be sharing high-quality trade setups for a period time. No bullshit, no fluff, no complicated nonsense — just real, actionable forecast the algorithm is executing. If you’re struggling with trading and desperate for better results, follow my posts closely.
Check out my previously posted setups and forecasts — you’ll be amazed by the high accuracy of the results.
AUDGBP trade ideas

GBP_AUD PULLBACK AHEAD|SHORT|
b]✅GBP_AUD has retested
A resistance level of 2.1036
And we are seeing a bearish reaction
With the price going down so we are
Bearish biased now and we will be
Expecting the pair to go further down
SHORT🔥
✅Like and subscribe to never miss a new idea!✅
Disclosure: I am part of Trade Nation's Influencer program and receive a monthly fee for using their TradingView charts in my analysis.

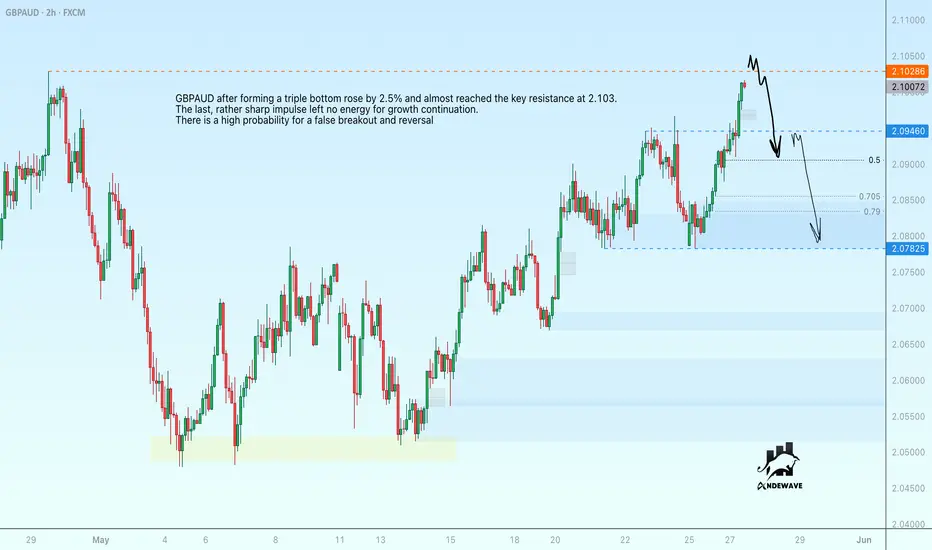
GBPAUD is preparing for a false breakout GBPAUD after forming a triple bottom rose by 2.5% and almost reached the key resistance at 2.103. The last, rather sharp impulse did not leave energy for continuation of growth. The probability for a false breakout and reversal is high
Scenario: a breakout of 2.103 resistance and a slight consolidation above the level followed by a return below 2.103 will make us realize that the price is not ready to go up. In this case, we should wait for a fall to 2.09 - 2.078.
GBPAUD Wave Analysis: Is a Rally to 2.13677 on the Horizon?Hey Realistic Traders!
Can $OANDA: GBPAUD Keep the Bull Run Alive? Let’s Break It Down...
Trend Analysis
On the H4 timeframe, GBPAUD has broken out of a double bottom pattern, signaling a shift from a short-term bearish trend to a bullish one. Bullish momentum is further confirmed by price action trading above the EMA-200 line. On the higher timeframe, a falling wedge breakout pattern supports the bullish continuation scenario, aligning with the broader wave structure.
Wave Analysis
Applying Elliott Wave theory, the recent price action suggests the completion of Wave 2 around the 0.786 Fibonacci retracement level, aligning with the neckline breakout of the double bottom pattern. The potential formation of Wave 3, typically the strongest and most impulsive wave, targets 2.10265 as the first extension level with a further extension to 2.13677, calculated using Fibonacci extensions of the current bullish wave.
The outlook remains valid as long as the price stays above the key stop-loss level at 2.04774, invalidating the Wave 3 setup if breached.
Support the channel by engaging with the content, using the rocket button, and sharing your opinions in the comments below.
Disclaimer: "Please note that this analysis is solely for educational purposes and should not be considered a recommendation to take a long or short position on GBPAUD.

BUY GBPAUD break out# GBP/AUD Trading Plan
1. **Entry:**
- Buy on candle close above consolidation box
- price above moving averages
2. **Stop Loss:**
- 2.07601 as indication price failed to break out
- Use 2% account risk max
3. **Take Profit:**
Next major resistance level
4. **Key Confirmations:**
- Increasing volume on breakout
- Higher timeframe uptrend intact
- Strong momentum indicators
5. **Management:**
- Move stop to breakeven at +50% to first target
- Take partial profits at first target

GBPAUD SHORT TERM SELLS BEFORE TE BUYSGbpAUD is expected to sell for a short term correction before the major buys

GBPAUD ANALYSIS Based on technical analysis GA is in a bullish trend and we should only be looking for buys.
Expect a pullback near the fibs tool reversal zone for a buy entry.
Risk Reward- 1% : 3 or your TP can be the 4H HH zone.
Keep your trading plan simple and only take quality trades in the direction of the trend. The trend is your soulmate.

Potential bullish rise?GBP/AUD has bounced off the pivot, which acts as an overlap support and could rise to the 1st resistance, which lines up with the 61.8% Fibonacci projection.
Pivot: 2.0789
1st Support: 2.0703
1st Resistance: 2.1072
Risk Warning:
Trading Forex and CFDs carries a high level of risk to your capital and you should only trade with money you can afford to lose. Trading Forex and CFDs may not be suitable for all investors, so please ensure that you fully understand the risks involved and seek independent advice if necessary.
Disclaimer:
The above opinions given constitute general market commentary, and do not constitute the opinion or advice of IC Markets or any form of personal or investment advice.
Any opinions, news, research, analyses, prices, other information, or links to third-party sites contained on this website are provided on an "as-is" basis, are intended only to be informative, is not an advice nor a recommendation, nor research, or a record of our trading prices, or an offer of, or solicitation for a transaction in any financial instrument and thus should not be treated as such. The information provided does not involve any specific investment objectives, financial situation and needs of any specific person who may receive it. Please be aware, that past performance is not a reliable indicator of future performance and/or results. Past Performance or Forward-looking scenarios based upon the reasonable beliefs of the third-party provider are not a guarantee of future performance. Actual results may differ materially from those anticipated in forward-looking or past performance statements. IC Markets makes no representation or warranty and assumes no liability as to the accuracy or completeness of the information provided, nor any loss arising from any investment based on a recommendation, forecast or any information supplied by any third-party.

GBPAUD…being the best is a mindset!!Good day traders, I am back again with another great setup and again another opportunity to learn something new.
On the daily TF on GBpAUD we still in a bearish structure and if we use the 2022 model, we had a structure shift lower and now that price is retesting the OTE entry levels we can now expect price to shoot lower, before you asked about the recent FVG on 4H TF. That newly formed BISI is that candle that created the BPR and from what I’ve learned is that price normally shoots past BPR’s.
My poll of liquidity is resting below(weekly), that Ray line makes weekly represents previous week’s low which we want to see the market get to. Just on top of that ray line we have a FVG that price left open, we also wanna see price fill that FVG fully.

GBPAUD 26/05/2025Weekly:
-Bullish M pattern.
Daily:
-Bullish M pattern.
-Liquidity sweep.
4H:
-Bullish M pattern.
-Inverse H&S pattern.
-IC.

GBPAUD: Bullish Bias Remains 🇬🇧🇦🇺
I already shared a confirmed bullish breakout of a falling trend line on a daily.
Though the price went a bit lower, below that after its retest,
we have a significant horizontal support cluster that strongly holds.
I think that the price may start rising from that and reach
2.1 level this week.
❤️Please, support my work with like, thank you!❤️
I am part of Trade Nation's Influencer program and receive a monthly fee for using their TradingView charts in my analysis.

GBPAUD - One More Leg for Bears to Take Over!Hello TradingView Family / Fellow Traders. This is Richard, also known as theSignalyst.
📈GBPAUD has been overall bullish trading within the rising channel marked in blue.
However, it is currently approaching the upper bound of its channel acting as an over-bought zone.
And the $2.1 - $2.104 is a strong resistance zone.
🏹 Thus, the highlighted red circle is a strong area to look for sell setups as it is the intersection of resistance and upper blue trendline acting as a non-horizontal resistance.
📚 As per my trading style:
As #GBPAUD is around the red circle zone, I will be looking for bearish reversal setups (like a double top pattern, trendline break , and so on...)
📚 Always follow your trading plan regarding entry, risk management, and trade management.
Good luck!
All Strategies Are Good; If Managed Properly!
~Rich
Disclosure: I am part of Trade Nation's Influencer program and receive a monthly fee for using their TradingView charts in my analysis.

Weekly outlook 5-6-25Weekly outlook 5-6-25 in this video i will show what i am gonna trade for today

EUR/AUD Short, CAD/JPY Short and GBP/AUD LongEUR/AUD Short
Minimum entry requirements:
• If structured 1H continuation forms, 1H risk entry within it.
CAD/JPY Short
Minimum entry requirements:
• Break above area of value.
• 1H impulse down below area of interest.
• If tight non-structured 15 min continuation follows, 5 min risk entry within it if the continuation is structured on the 5 min chart or reduced risk entry on the break of it.
• If tight structured 15 min continuation follows, reduced risk entry on the break of it or 15 min risk entry within it.
GBP/AUD Long
Minimum entry requirements:
• Break below area of value.
• 1H impulse up above area of value.
• If tight non-structured 5 min continuation follows, reduced risk entry on the break of it.
• If tight structured 5 min continuation follows, reduced risk entry on the break of it or 5 min risk entry within it.
• If tight non-structured 15 min continuation follows, 5 min risk entry within it if the continuation is structured on the 5 min chart or reduced risk entry on the break of it.
• If tight structured 15 min continuation follows, reduced risk entry on the break of it or 15 min risk entry within it.
EUR/USD Short
Minimum entry requirements:
• 1H impulse down below area of value.
• If tight non-structured 5 min continuation follows, reduced risk entry on the break of it.
• If tight structured 5 min continuation follows, reduced risk entry on the break of it or 5 min risk entry within it.
• If tight non-structured 15 min continuation follows, 5 min risk entry within it if the continuation is structured on the 5 min chart or reduced risk entry on the break of it.
• If tight structured 15 min continuation follows, reduced risk entry on the break of it or 15 min risk entry within it.

GBPAUD FORECASTThe new week is already in Motion! And GBPAUD is looking very stunning for today. Let's be patient and wait to see how the market is going to develop! Remember to be patient before making any decision!

GBPAUD Technical & Order Flow AnalysisOur analysis is based on multi-timeframe top-down analysis & fundamental analysis.
Based on our view the price will rise to the monthly level.
DISCLAIMER: This analysis can change anytime without notice and is only for assisting traders in making independent investment decisions. Please note that this is a prediction, and I have no reason to act on it, and neither should you.
Please support our analysis with a boost or comment!

"GBP/AUD Bullish Continuation Setup The GBP/AUD pair on the 15-minute chart shows a bullish continuation pattern following a breakout from a falling channel, which indicates a bullish flag formation. The price action has moved strongly upward, suggesting buying momentum and potential for further gains. The market sentiment appears bullish, supported by the price trading above key moving averages and the breakout occurring with strength.
Entry Point: 2.08350
Target: 2.09800
Stop loss : 2.08280
.

#GBPAUD: Will price reverse to bullish, or continue dropping? GBPAUD fell further below our expectations in our previous analysis, but the price remains extremely bearish. GBP failed to hold on to its bullish momentum, leading the pair to drop 300 pips from our previous entry zone. Currently, price is trading at a key buying level, where we can expect a strong bullish volume to kick in the market and help us gain a nice clean bullish move. There are two areas for both entries. At the moment, you can use a small time frame to take any swing buy entry. Please ensure you manage your risk accurately before getting into the market.
Good luck and trade safely!
Thank you for your unwavering support! 😊
If you’d like to contribute, here are a few ways you can help us:
- Like our ideas
- Comment on our ideas
- Share our ideas
Team Setupsfx_
❤️🚀

GBP/AUD Forex Heist - Bearish Breakout Blitz!🔥 Thief Trading Style: GBP/AUD Bearish Heist Plan 🔥
Hello, Profit Pirates & Market Marauders! 🤑
Get ready to raid the GBP/AUD (Pound vs. Aussie) forex market with a slick bearish strategy! 📊 Our Thief Trading Style fuses technical precision and fundamental insights to target a sharp downside move. Follow this charted plan to hit the high-risk Blue MA Zone and slip away with profits. Let’s make this heist count! 💪🎯
---
📊 Heist Blueprint: Trade Setup
- Market: GBP/AUD (Forex) 🌐
- Bias: Bearish Breakout 🌟
- Timeframe: 4H (Scalping/Day Trade) ⏰
Entry 📉:
- Breakout Move: Wait for a confirmed break below the Neutral Level at 2.05300. Place Sell Stop orders just below 2.05300 to ride the bearish wave. 🚀
- Pullback Play: For safer entries, set Sell Limit orders at the nearest 15M/30M swing high (e.g., 2.05600-2.05800) after a support break for pullback trades. 📍
- Trader Tip: Set a TradingView alert for the 2.05300 breakout to catch the action live! 🔔
Stop Loss 🛑:
- Breakout Traders: After the break confirms, place your Stop Loss above the recent 4H swing high at 2.08000 to shield against reversals. ⚠️
- Pullback Traders: Adjust Stop Loss based on your risk (e.g., 1-2% of account). Factor in lot size and multiple orders for precision. 📏
- Risk Alert: This is a high-octane heist! Keep position sizes tight to protect your capital. 🔥
Target 🎯:
- Aim for 2.03200, near the risky Blue MA Zone (an oversold area with potential consolidation or reversal). 🏴☠️
- Exit Strategy: Take profits early if bullish signals (e.g., pin bars, high volume) appear near 2.03200. 💸
Scalpers 👀:
- Focus on short-side scalps with tight trailing stops. Pair with day traders for the full heist or snag quick pips if your account supports it. 💰
---
📡 Why This Heist Could Pay Off
GBP/AUD is showing bearish momentum, fueled by:
- Technicals: A break below 2.05300, backed by lower highs on the 4H chart, signals strong downside potential. 📊
- Fundamentals: Weak UK economic data and Aussie strength (check COT reports) support a bearish outlook. 📰
- Seasonal Trends: GBP/AUD often softens in Q2 due to macroeconomic shifts. 📅
- Intermarket Factors: AUD’s correlation with commodity prices could pressure GBP lower. 🌎
---
⚠️ Risk Management: Guard Your Loot
- News Caution: Avoid new trades during high-impact events (e.g., UK CPI, RBA minutes) to sidestep volatility spikes. 🗞️
- Trailing Stops: Use trailing Stop Loss to secure profits as price approaches 2.03200. 🔒
- Position Sizing: Cap risk at 1-2% of your account per trade to stay in the game. 🚨
---
💥 Fuel the Heist! 💥
Join our Thief Trading Style crew by liking, commenting, and following for more electrifying trade plans! 🚀 Your support powers our market raids, helping us score profits with flair. Let’s dominate GBP/AUD together! 🤝🏆🎉
Hashtags: #GBPAUD #Forex #Bearish #DayTrading #Scalping #Breakout
Stay Alert: Another heist is brewing. Keep your charts primed, traders! 🐱👤😎

GBP/AUD Long – Fundamental Divergence and Pullback Zone 🧠 Idea Description:
I am considering a long position on the GBP/AUD currency pair based on clear fundamental divergence between the two economies.
📊 Fundamental Summary:
🔹 🇬🇧 United Kingdom (GBP):
Inflation rose to 3.5% in April (Reuters) – this puts pressure on the Bank of England to pause rate cuts.
BoE interest rate is currently at 4.25%, and further cuts are unlikely (Bank of England).
Retail sales surprised to the upside at +1.2%, showing strong consumer demand (The Times).
🔹 🇦🇺 Australia (AUD):
The Reserve Bank of Australia cut rates to 3.85% – the second cut this year – as inflation returns to target (RBA).
Economic slowdown continues; unemployment is expected to rise in 2025 (RBA SMP).
🧭 Conclusion:
There is a clear divergence in monetary policy and economic outlook:
➡ GBP remains strong due to persistent inflation and resilient consumer demand.
➡ AUD weakens as rate cuts and economic slowdown weigh on sentiment.
📌 → Fundamentally supported long bias on GBP/AUD.
"This idea is for educational and informational purposes only. It does not constitute financial advice. Please conduct your own research before making any trading decisions."

GBP/AUD - Bullish Channel (22.05.2025)The GBP/AUD pair on the M30 timeframe presents a Potential Buying Opportunity due to a recent Formation of a Channel Pattern. This suggests a shift in momentum towards the upside and a higher likelihood of further advances in the coming hours.
Possible Long Trade:
Entry: Consider Entering A Long Position around Trendline Of The Pattern.
Target Levels:
1st Resistance – 2.0961
2nd Resistance – 2.1047
🎁 Please hit the like button and
🎁 Leave a comment to support for My Post !
Your likes and comments are incredibly motivating and will encourage me to share more analysis with you.
Best Regards, KABHI_TA_TRADING
Thank you.
Disclosure: I am part of Trade Nation's Influencer program and receive a monthly fee for using their TradingView charts in my analysis.

GBP/AUD SELLERS WILL DOMINATE THE MARKET|SHORT
Hello, Friends!
Previous week’s green candle means that for us the GBP/AUD pair is in the uptrend. And the current movement leg was also up but the resistance line will be hit soon and upper BB band proximity will signal an overbought condition so we will go for a counter-trend short trade with the target being at 2.044.
Disclosure: I am part of Trade Nation's Influencer program and receive a monthly fee for using their TradingView charts in my analysis.
✅LIKE AND COMMENT MY IDEAS✅

GBPAUD – Potential Long Swing Trading OpportunityThis forex pair has full confluence with a xBrat Roller Coaster (RC) long signal on the 20th May. Then on the 22nd May an xBratAlgo (XA) 5* BUY Signal. Whilst the BIAS Depth Heatmap (BDHP) is all Green!
Price is trying to push through weekly resistance right now so a sensible entry would be 2.10514 with a Stop Market Order. Stop Loss at 2.04814. And with a target of 2.23000, there is a lot of fresh air (Risk to Reward) to the next weekly resistance zone.
At the end of January this year we had another confluence bullish trade that did extremely well, as can be seen on the chart. Trailing stop position is the line between the two green zones during the trade.
