GBPAUD SHORT Market structure bearish on HTFs DH
Entry at both Weekly and Daily AOi
Weekly Rejection at AOi
Daily Rejection at AOi
Previous Structure point Daily
Around Psychological Level 2.05500
H4 EMA retest
H4 Candlestick rejection
Rejection from Previous structure
Levels 3.78
Entry 100%
REMEMBER : Trading is a Game Of Probability
: Manage Your Risk
: Be Patient
: Every Moment Is Unique
: Rinse, Wash, Repeat!
: Christ is King.
AUDGBP trade ideas

GBPAUD Breakout of resistance 4 hr GBPAUD candle has broken the trendline resistance and is likely to go up. enter on retesting the support.
buy gbpaudwe reach to support level and have a up trend and now price reach to a demand zone and we have spin candles and we enter...
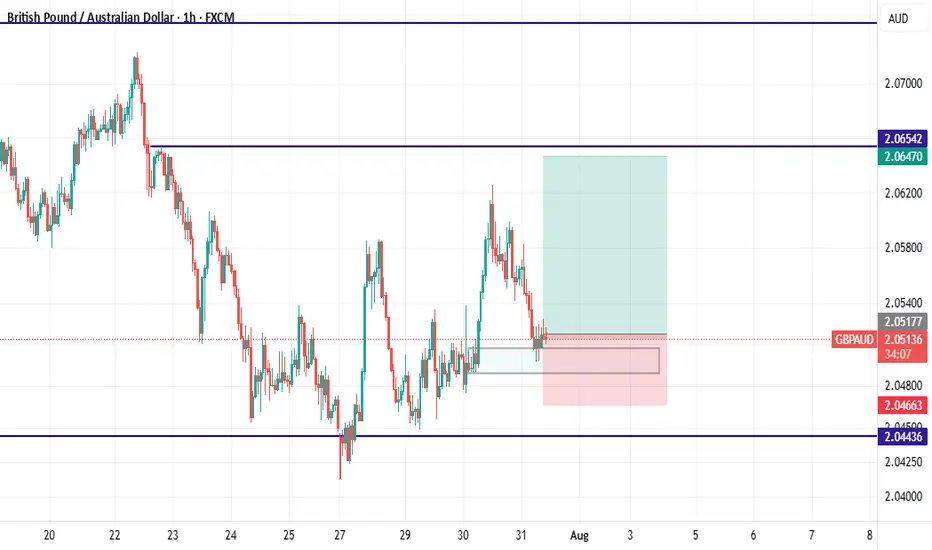
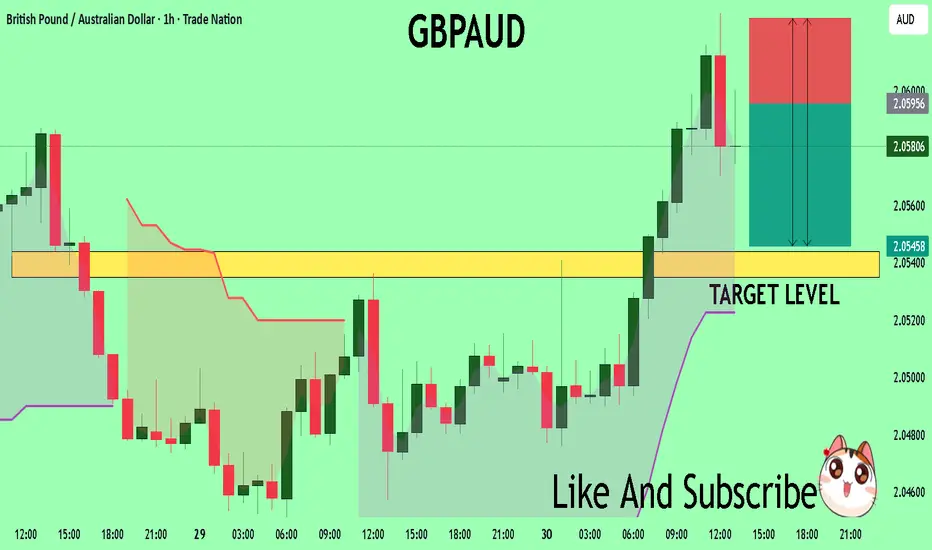
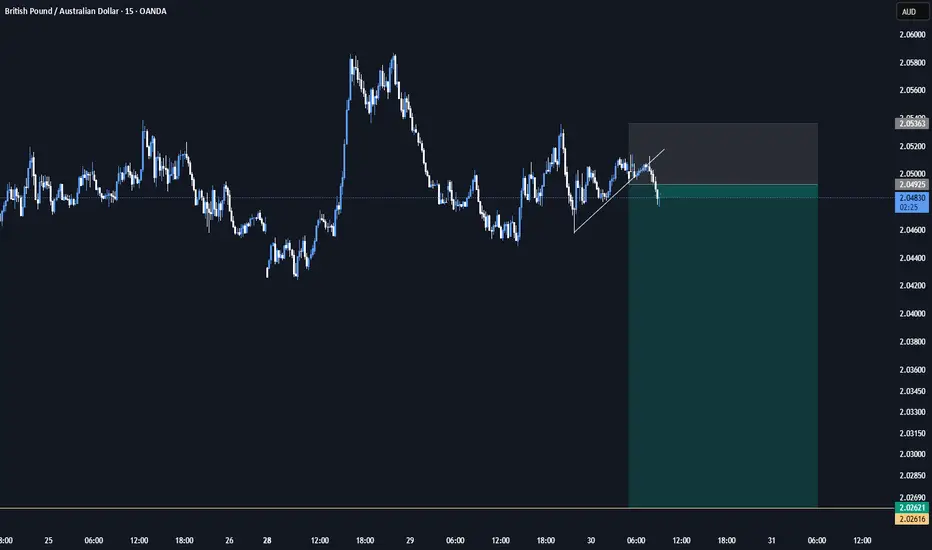
GBP AUD Price is showing strong signs of accumulation near the 2.0450–2.0470 demand zone, forming a clean range low sweep + BOS (Break of Structure).
🔹 Area of Interest: Watching for a retracement back into the marked zone for a potential long setup.
🔹 Confirmation: Break of structure confirmed at ~2.0535
🔹 Stop: Below the sweep low (~2.0420)
🔹 Target: Above previous supply zone (~2.0650–2.07), expecting a strong impulsive leg up if momentum sustains.

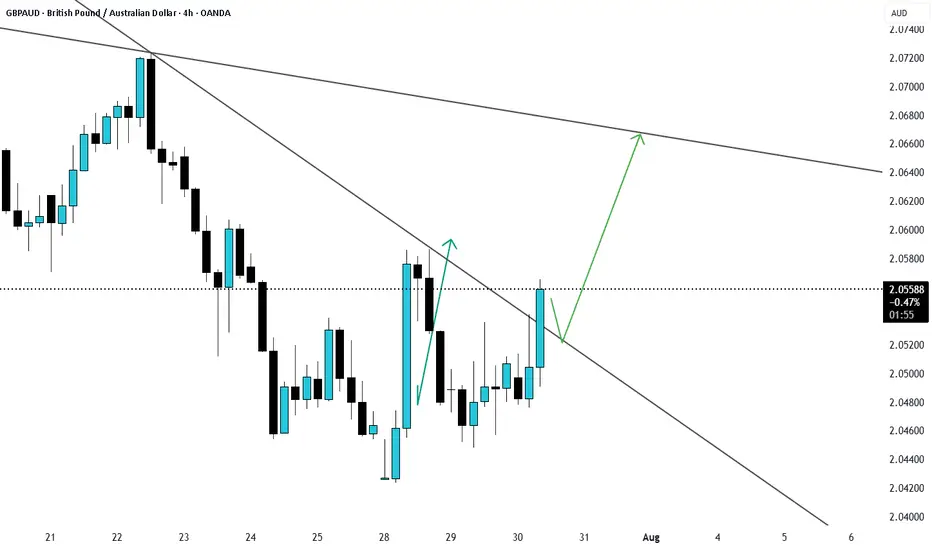
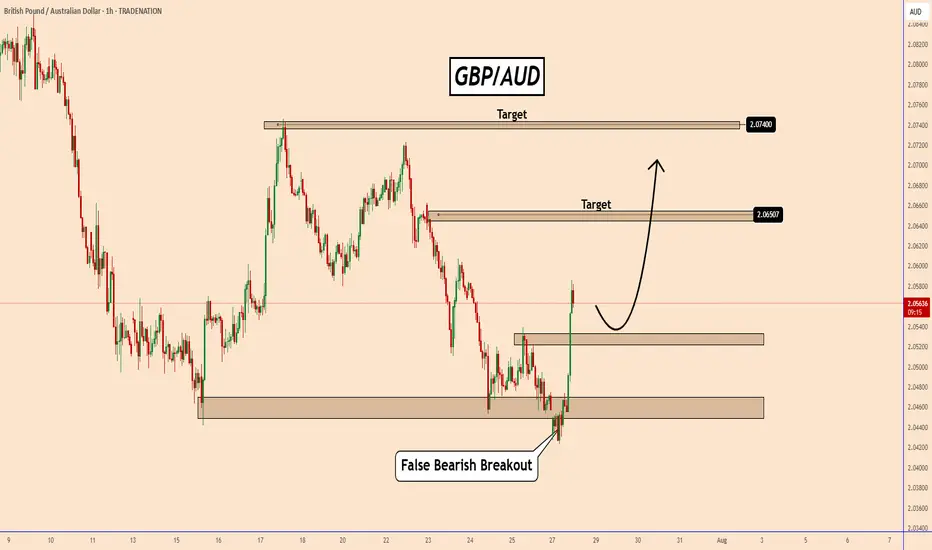
GBPAUD transformed its chart quickly from bearish to bullish!GBPAUD transformed its chart quickly from bearish to bullish!
During the opening of the Market today, GBPAUD created a clear bearish breakout structure and later canceled that breakout.
From the chart we can see a false bearish breakout and GBPAUD is already positioned for a bullish move.
The bullish move is very aggressive and the price increased by almost 135 pips in just 2.5 hours.
After a short pause, GBPAUD should increase further to 2.0650 and 2.0740.
You may find more details in the chart!
Thank you and Good Luck!
PS: Please support with a like or comment if you find this analysis useful for your trading day
Disclosure: I am part of Trade Nation's Influencer program and receive a monthly fee for using their TradingView charts in my analysis.
GBPAUD is Holding above the Support , All Eyes on BuyingHello Traders
In This Chart GBPAUD HOURLY Forex Forecast By FOREX PLANET
today GBPAUD analysis 👆
🟢This Chart includes_ (GBPAUD market update)
🟢What is The Next Opportunity on GBPJPY Market
🟢how to Enter to the Valid Entry With Assurance Profit
This CHART is For Trader's that Want to Improve Their Technical Analysis Skills and Their Trading By Understanding How To Analyze The Market Using Multiple Timeframes and Understanding The Bigger Picture on the Charts

GBPAUD Massive Short! SELL!
My dear subscribers,
My technical analysis for GBPAUDis below:
The price is coiling around a solid key level - 2.0596
Bias - Bearish
Technical Indicators: Pivot Points Low anticipates a potential price reversal.
Super trend shows a clear sell, giving a perfect indicators' convergence.
Goal - 2.0543
My Stop Loss - 2.0626
About Used Indicators:
By the very nature of the supertrend indicator, it offers firm support and resistance levels for traders to enter and exit trades. Additionally, it also provides signals for setting stop losses
Disclosure: I am part of Trade Nation's Influencer program and receive a monthly fee for using their TradingView charts in my analysis.
———————————
WISH YOU ALL LUCK
GBP/AUD: Pound Surge to 2.066?FX:GBPAUD is forming a bullish reversal on the 4-hour chart, testing support at 2.05037 with a buy trigger between 2.05037-2.05115. Target 2.066 aligns with the next resistance level, offering a solid risk-reward setup. Set a stop loss at 2.0493 below the recent low. Watch GBP strength and AUD data for catalysts. Trade with precision!
Share your opinion with me in the comments.
#GBPAUD #ForexTrading #TechnicalAnalysis #TradingView #CurrencyPairs #DayTrading #MarketSignals

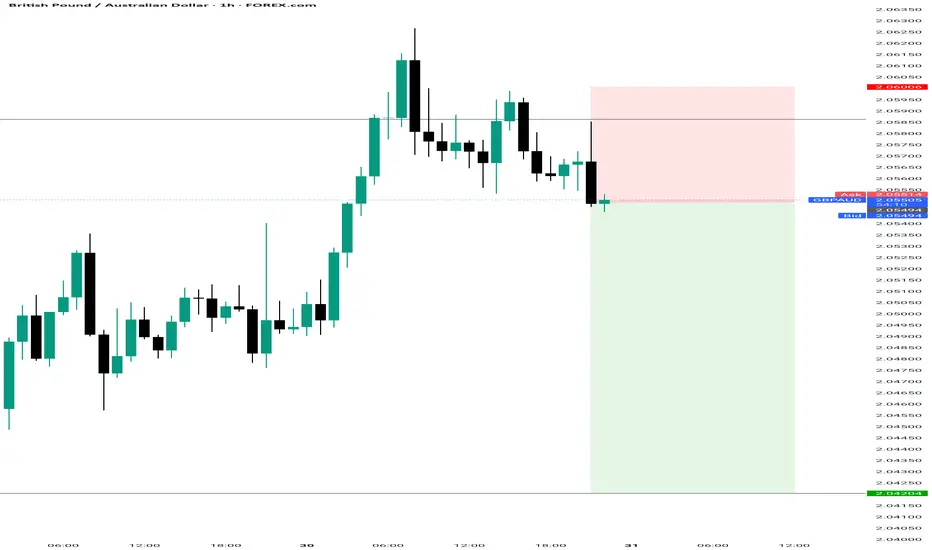
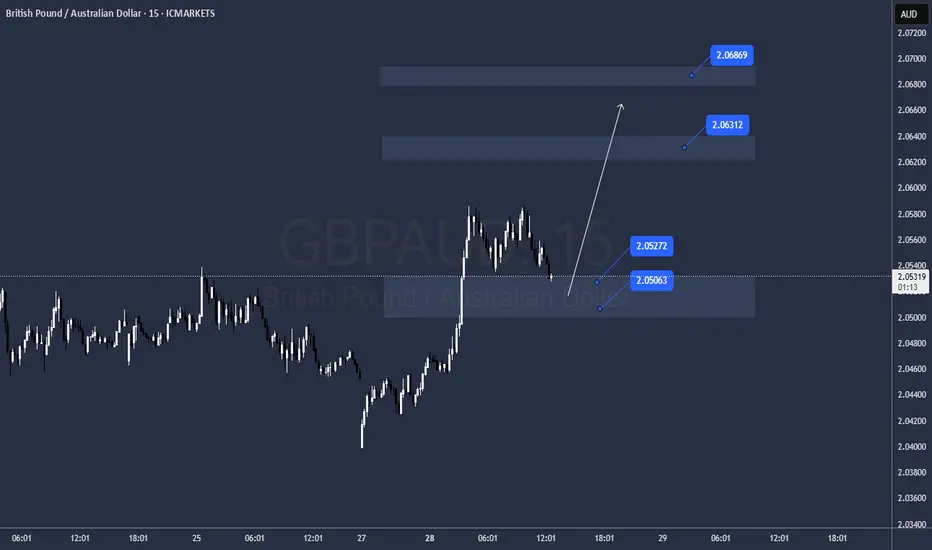
GBPAUD BUY OPPORTUNITY!📊 Current Market Behavior:
Price is retracing back toward the OB and FVG zone after a bullish move.
A small pullback is expected (as shown by the downward leg of the arrow) to mitigate the OB/FVG.
After mitigation, a strong bullish continuation is anticipated.
⚠️ Watch For:
Bullish confirmation inside OB (e.g., bullish engulfing, strong rejection wicks)
Reaction volume and candle strength during the London or NY session
Failure to hold OB may lead to price revisiting 2.04206

buy gbpaudwe reach to a support level and break trend line and also break last LH and also pullback to a strong demand zone....
Is the currency GBPAUD depreciating?
Hi dears
I think that if the colored trend line is broken, the downtrend will probably continue until it reaches the target.
Thank you for supporting me by liking, commenting, and subscribing.

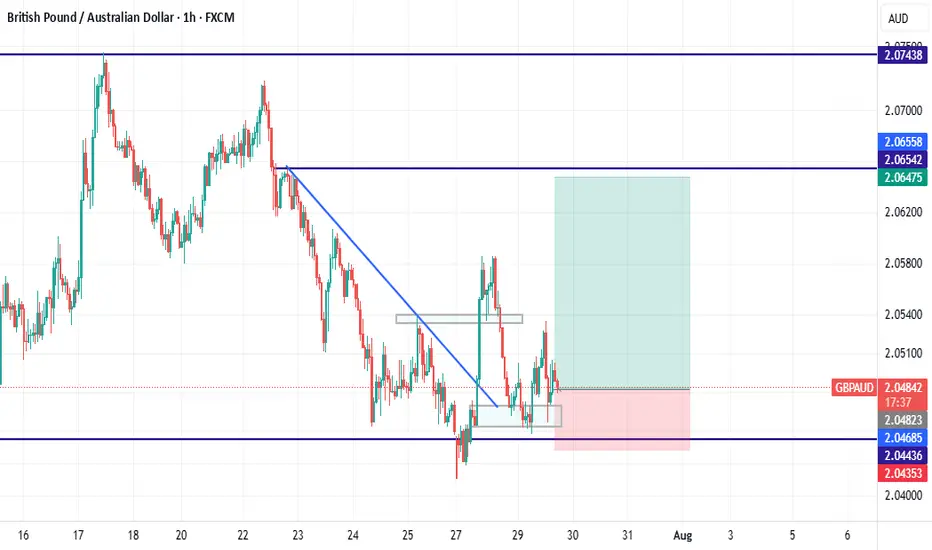
GBPAUD: Calm Before the ConfirmationPrice has swept liquidity below the previous week's low and broke structure to the upside. Now it’s retracing into a Fair Value Gap that aligns beautifully with the 38.2% to 50% Fibonacci zone.
I'm not in yet. I’m watching for a clean bullish confirmation, like an engulfing or strong rejection candle, before entering .
The 50 EMA supports the bias and helps confirm that I'm trading in the direction of the short-term momentum. If all aligns, I’ll be targeting the previous week’s high.
This is a reminder that being patient often protects your capital more than being early.

GBPAUD breakdown targets 2.00GBPAUD broke below key triangle support, confirming a bearish pattern with a target near 2.00. A failed retest strengthens the case for further downside. Bounces toward 2.06 may face selling pressure. Reward-to-risk remains attractive around 2.55x.
This content is not directed to residents of the EU or UK. Any opinions, news, research, analyses, prices or other information contained on this website is provided as general market commentary and does not constitute investment advice. ThinkMarkets will not accept liability for any loss or damage including, without limitation, to any loss of profit which may arise directly or indirectly from use of or reliance on such information.

Sell gbpoudA clear reversal pattern in weekly time frame we patiently wait for breakout before selling

GBPAUD SHORT IDEAIm looking for short on GBPAUD based on current trend and price action and RSI not reach yet the overbought level on daily. And CPI AUD news will come in few minutes . All the best traders

GBPAUD - Bullish Price Action GBPAUD broke out of a reversal structure with a double bottom confluence. Expecting further growth for a long opportunity.
Good Luck

GBPAUD: Bullish Forecast & Outlook
Balance of buyers and sellers on the GBPAUD pair, that is best felt when all the timeframes are analyzed properly is shifting in favor of the buyers, therefore is it only natural that we go long on the pair.
Disclosure: I am part of Trade Nation's Influencer program and receive a monthly fee for using their TradingView charts in my analysis.
❤️ Please, support our work with like & comment! ❤️


GBPAUD Is Going Up! Buy!
Here is our detailed technical review for GBPAUD.
Time Frame: 1D
Current Trend: Bullish
Sentiment: Oversold (based on 7-period RSI)
Forecast: Bullish
The market is testing a major horizontal structure 2.051.
Taking into consideration the structure & trend analysis, I believe that the market will reach 2.072 level soon.
P.S
The term oversold refers to a condition where an asset has traded lower in price and has the potential for a price bounce.
Overbought refers to market scenarios where the instrument is traded considerably higher than its fair value. Overvaluation is caused by market sentiments when there is positive news.
Disclosure: I am part of Trade Nation's Influencer program and receive a monthly fee for using their TradingView charts in my analysis.
Like and subscribe and comment my ideas if you enjoy them!

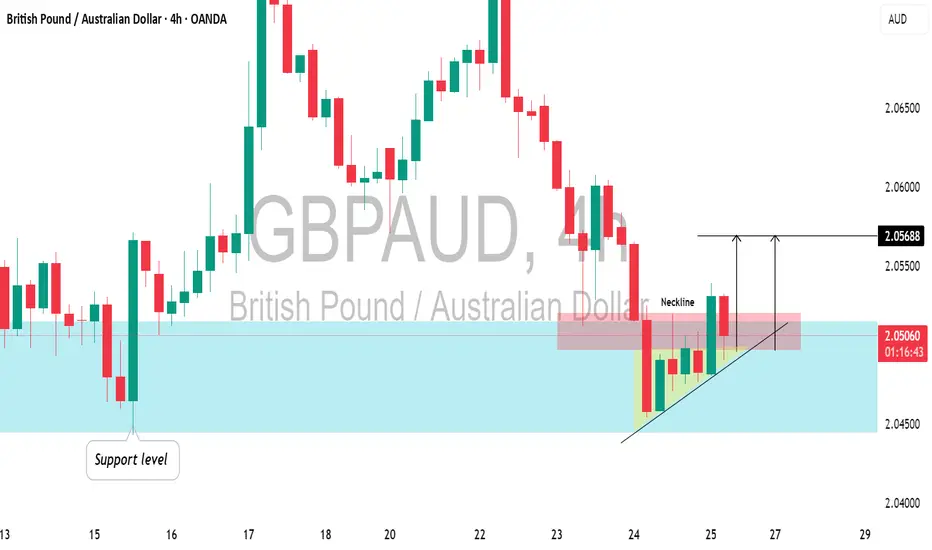
GBPAUD: Another Pullback Trade for TodayGBPAUD formed an ascending triangle pattern at a significant daily/intraday horizontal support.
And breaking its neckline indicates buyer strength.
I anticipate the pair could rise to the 2.0568 level.