23.04.25 Morning ForecastPairs on Watch -
FX:GBPAUD
FX:AUDCAD
FX:USDCHF
A short overview of the instruments I am looking at for today, multi-timeframe analysis down to what I will be looking at for an entry. Enjoy!
AUDGBP trade ideas

GBP AUD #0011 Short Swing Trade - Short limit order was made after a failed breakout and formation of orderblock at the nearest Monthly HIGH .
- weekly price action showed a better imagery of the failed breakout.
- Trade is contrarian in nature.
- Holding period will be 3 days to 10 days, swing.
- The failed breakout indicates exhaustion in buying interest.
- the placement of limit order for sell at the highest price within the order blocks was made here at night time in the Peninsular.
- Leaving a greatly vague explanation here for my viewers, for that I apologize.
- Price is ripe for a correction to compensate for the FVG price imbalanced, which we are planning to capitalize and place our short limit entry.
- the target is the closest weekly liquidity pools.
- and the wait begins

GBPAUD trade ideaFX:GBPAUD
Entered buys on GBPAUD
Reason buy:
1) catch trade towards supply zone above
2) price broke out of supply zone below and retested
3) 1H timeframe created a spinning top on the retested red zone
4) Price created a higher high and came back to retest on 15 min timeframe
5) 15 min created a hammer candle

GBPAUD Will Go Up! Buy!
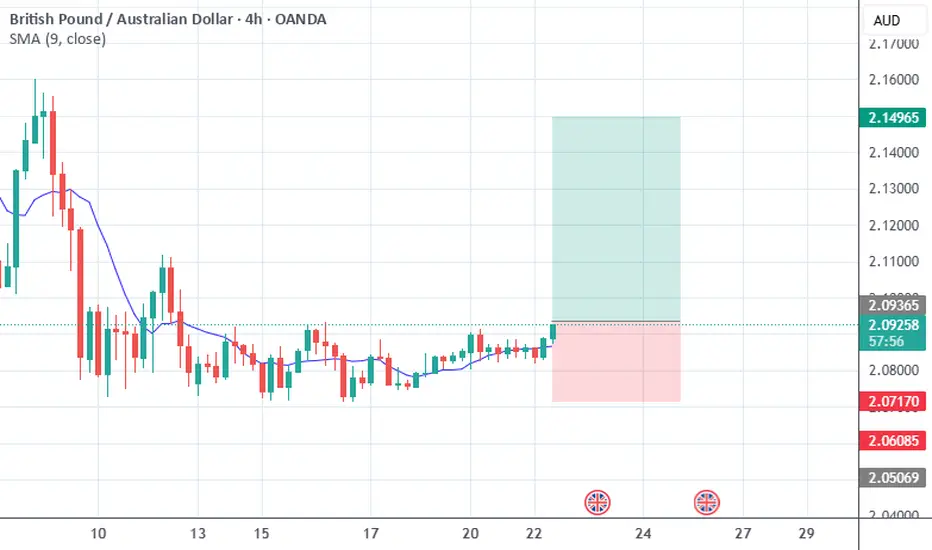
Here is our detailed technical review for GBPAUD.
Time Frame: 1D
Current Trend: Bullish
Sentiment: Oversold (based on 7-period RSI)
Forecast: Bullish
The market is trading around a solid horizontal structure 2.090.
The above observations make me that the market will inevitably achieve 2.149 level.
P.S
We determine oversold/overbought condition with RSI indicator.
When it drops below 30 - the market is considered to be oversold.
When it bounces above 70 - the market is considered to be overbought.
Disclosure: I am part of Trade Nation's Influencer program and receive a monthly fee for using their TradingView charts in my analysis.
Like and subscribe and comment my ideas if you enjoy them!

gbpaud buy tradeThe Relative Strength Index (RSI) is showing an upward trend, indicating increasing momentum. Additionally, the Moving Average Convergence Divergence (MACD) is showing a bullish crossover, further supporting the potential for an upward move.
GBPAUD INTRADAY sideways consolidation supported at 2.0590GBPAUD maintains a bullish bias, supported by the prevailing upward trend. Recent intraday movement indicates a corrective pullback toward a key consolidation zone, offering a potential setup for trend continuation.
Key Support Level: 2.0595 – previous consolidation range and pivotal support
Upside Targets:
2.1380 – initial resistance
2.1642 and 2.1970 – extended bullish targets on higher timeframes
A bullish reversal from 2.0595 would suggest continuation of the uptrend, confirming buying momentum.
However, a decisive break and daily close below 2.0595 would invalidate the bullish structure, opening the door for further retracement toward 2.0460, with additional support at 2.0316 and 2.0134.
Conclusion
GBPAUD remains bullish above 2.0595. A bounce from this level supports further gains. Traders should watch for confirmation signals before positioning for the next move.
This communication is for informational purposes only and should not be viewed as any form of recommendation as to a particular course of action or as investment advice. It is not intended as an offer or solicitation for the purchase or sale of any financial instrument or as an official confirmation of any transaction. Opinions, estimates and assumptions expressed herein are made as of the date of this communication and are subject to change without notice. This communication has been prepared based upon information, including market prices, data and other information, believed to be reliable; however, Trade Nation does not warrant its completeness or accuracy. All market prices and market data contained in or attached to this communication are indicative and subject to change without notice.

GBPAUD Retests Double Top NecklineGBPAUD has broken the key support level of a double top pattern. The price is now caught between two important zones: the neckline of the double top, which is now acting as resistance, and the former resistance zone at 2.0725–2.0775, which has turned into support.
If this support fails, GBPAUD may continue toward the double top’s projected target near 2.04. However, if the neckline is reclaimed, the bearish setup would be invalidated.

GBPAUD We looking for shorts on the third touch of the ascending pattern, We anticipate price to consolidate before selling pressure pushes price bearish

GBPAUD SELL/SHORTBy utilizing levels, historical patterns, , we can formulate a hypothesis that the market might follow a similar trajectory if bearish sentiment prevails.

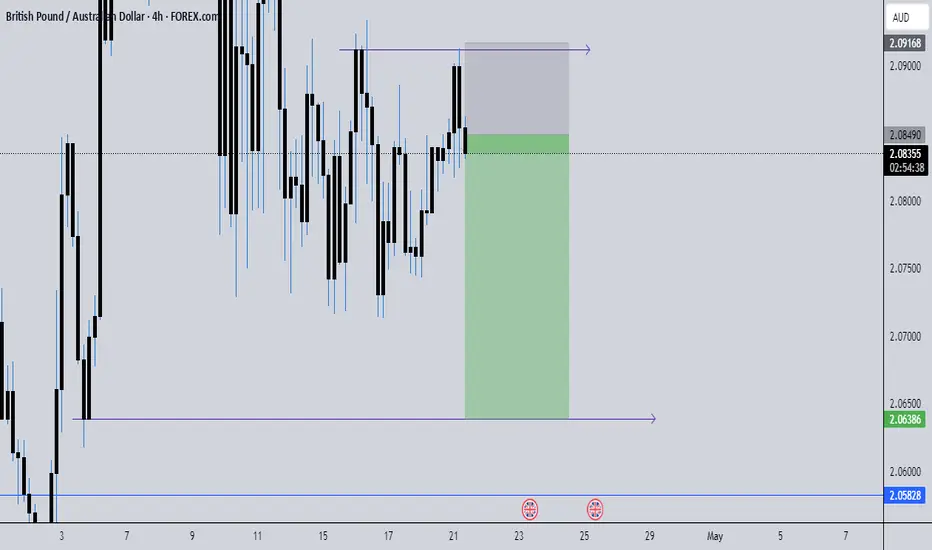
GBPAUD sellThere are a lot of sell confluences for this pair in all timeframes.
Here are the reasons for my bias:
- First of all, there was a very strong 3 month target that was hit at 2.1050 on 4th April
- Price hit a major monthly and 3M level at 2.1500 and we saw sharp rejections of that rejection.
- The monthly candlestick is looking to close very bearish since there is a long wick that has rejected the 2.1500 region
- 2.03 is a major monthly level that was broken but was never retested. I believe that price is due for a retest now.
- On the weekly timeframe, there is a bearish candlestick formation which is followed by last week's small indecision candlestick.
-Whenever we see an indecision candlestick, it usually means that price is collecting orders before we see a major move to either direction.
- I believe that the indecision candlestick is meant to indicate that price is headed lower.
- On the daily timeframe, Friday (11th April) candlestick is clearly bearish indicating that price is headed lower.
- Price has been consolidating for quite sometime indicating that orders are being collected.
- The next notable region on the daily timeframe is at 2.0600, which I believe we will see this week.
- I am currently in a sell setup since the 4h and 1h timeframe have confirmed my bias
- Price on the 4 hour has hit a major liquidity region at 2.09 where we have seen bearish rejections in previous price action
- Price has formed an entry on the 1 hour timeframe by forming a double top with a huge bearish rejection
- My take profit is at 2.0640, as this is the next major liquidity region.
GBPAUD NULLISH OR BEARISH DETAILED ANALYSIS GBPAUD is currently trading around the 2.0850 level, hovering just above a strong confluence support zone as seen on the 12H chart. Price action has formed a bullish symmetrical triangle pattern following a strong impulsive rally earlier this month. This compression near a major demand zone signals a potential bullish breakout as price builds pressure right above the support base. The 2.0700–2.0600 region has historically acted as a key level, now reinforcing itself as solid structure support.
Technically, this setup is clean and aligned with classic continuation pattern behavior. We had a strong rally leading into the triangle, and the market has been respecting both the lower support boundary and declining resistance trendline. The recent candles show signs of rejection from the lower bounds of the wedge, adding to the bullish sentiment. A confirmed breakout above 2.0900 could trigger a fresh wave of upside momentum targeting the 2.1300–2.1600 zone in the coming sessions.
Fundamentally, GBP remains supported by stronger-than-expected inflation data and ongoing hawkish tones from the Bank of England. Markets are dialing back expectations of near-term rate cuts, giving the pound further upside traction. Meanwhile, AUD is weakening amid soft Chinese economic data, increasing risk aversion, and fading demand for commodities. Australia’s labor market also showed signs of cooling, reducing the RBA’s tightening pressure and putting the Aussie on the back foot.
This is a high-probability swing setup gaining traction on TradingView due to the combination of strong technical formation and macro divergence. With the pattern maturing above support and a clear bullish structure, GBPAUD is offering an attractive risk-to-reward scenario for bulls eyeing continuation into Q2. Patience on the breakout confirmation will be key, but the bias remains clearly bullish from both a chart and economic perspective.

[GBPAUD] Trade idea - first entryOn this trade idea, I took a first anticipated entry but then I will wait for the break and retest to size even more.
Great Trade !

GBP_AUD WAIT FOR BREAKOUT|SHORT|
✅GBP_AUD is consolidating in
A bearish triangle pattern
So we are bearish biased
And If we see a breakout
To the downside we will
Be able to go short on the
Pair expecting a further
Move down
SHORT🔥
✅Like and subscribe to never miss a new idea!✅
Disclosure: I am part of Trade Nation's Influencer program and receive a monthly fee for using their TradingView charts in my analysis.


GBPAUD Will Fall! Short!
Take a look at our analysis for GBPAUD.
Time Frame: 2h
Current Trend: Bearish
Sentiment: Overbought (based on 7-period RSI)
Forecast: Bearish
The market is testing a major horizontal structure 2.075.
Taking into consideration the structure & trend analysis, I believe that the market will reach 2.060 level soon.
P.S
Overbought describes a period of time where there has been a significant and consistent upward move in price over a period of time without much pullback.
Disclosure: I am part of Trade Nation's Influencer program and receive a monthly fee for using their TradingView charts in my analysis.
Like and subscribe and comment my ideas if you enjoy them!

GBP-AUD Bearish Triangle Pattern! Sell!
Hello,Traders!
GBP-AUD has formed a
Bearish triangle pattern
So we are bearish biased
And IF we see a bearish
Breakout then we will be
Expecting a further
Bearish continuation
Sell!
Comment and subscribe to help us grow!
Check out other forecasts below too!
Disclosure: I am part of Trade Nation's Influencer program and receive a monthly fee for using their TradingView charts in my analysis.

GBP/AUD "Pound vs Aussie" Forex Bank Heist Plan (Scalping/Day)🌟Hi! Hola! Ola! Bonjour! Hallo! Marhaba!🌟
Dear Money Makers & Robbers, 🤑💰✈️
Based on 🔥Thief Trading style technical and fundamental analysis🔥, here is our master plan to heist the GBP/AUD "Pound vs Aussie" Forex Market. Please adhere to the strategy I've outlined in the chart, which emphasizes short entry. Our aim is the high-risk ATR Zone. Risky level, oversold market, consolidation, trend reversal, trap at the level where traders and bullish robbers are stronger. 🏆💸"Take profit and treat yourself, traders. You deserve it!💪🏆🎉
Entry 📈 : "The heist is on! Wait for the breakout then make your move at (2.07100) - Bearish profits await!"
however I advise to Place sell stop orders below the Breakout level (or) after the breakout of Support level Place sell limit orders within a 15 or 30 minute timeframe most NEAREST (or) SWING low or high level for Pullback entries.
📌I strongly advise you to set an "alert (Alarm)" on your chart so you can see when the breakout entry occurs.
Stop Loss 🛑: "🔊 Yo, listen up! 🗣️ If you're lookin' to get in on a sell stop order, don't even think about settin' that stop loss till after the breakout 🚀. You feel me? Now, if you're smart, you'll place that stop loss where I told you to 📍, but if you're a rebel, you can put it wherever you like 🤪 - just don't say I didn't warn you ⚠️. You're playin' with fire 🔥, and it's your risk, not mine 👊."
📌Thief SL placed at the nearest/swing High or Low level Using the 4H timeframe (2.10000) Day/Scalping trade basis.
📌SL is based on your risk of the trade, lot size and how many multiple orders you have to take.
Target 🎯: 2.04700 (or) Escape Before the Target
💰💵💴💸GBP/AUD "Pound vs Aussie" Forex Bank Heist Plan (Day / Scalping Trade) is currently experiencing a Neutral trend (there is a chance to move bearishness).., driven by several key factors.👇👇👇
📰🗞️Get & Read the Fundamental, Macro Economics, COT Report, Quantitative Analysis, Sentimental Outlook, Intermarket Analysis, Future trend targets & Overall Score... go ahead to check 👉👉👉🔗🔗
⚠️Trading Alert : News Releases and Position Management 📰 🗞️ 🚫🚏
As a reminder, news releases can have a significant impact on market prices and volatility. To minimize potential losses and protect your running positions,
we recommend the following:
Avoid taking new trades during news releases
Use trailing stop-loss orders to protect your running positions and lock in profits
💖Supporting our robbery plan 💥Hit the Boost Button💥 will enable us to effortlessly make and steal money 💰💵. Boost the strength of our robbery team. Every day in this market make money with ease by using the Thief Trading Style.🏆💪🤝❤️🎉🚀
I'll see you soon with another heist plan, so stay tuned 🤑🐱👤🤗🤩

EUR/NZD Short, GBP/USD Long, AUD/USD Short and GBP/AUD ShortEUR/NZD Short
Minimum entry requirements:
• Corrective tap into area of value.
• 4H risk entry or 1H risk entry after 2 x 1H rejection candles.
Minimum entry requirements:
• Tap into area of value.
• 1H impulse down below area of value.
• If tight non-structured 5 min continuation follows, reduced risk entry on the break of it.
• If tight structured 5 min continuation follows, reduced risk entry on the break of it or 5 min risk entry within it.
• If tight non-structured 15 min continuation follows, 5 min risk entry within it if the continuation is structured on the 5 min chart or reduced risk entry on the break of it.
• If tight structured 15 min continuation follows, reduced risk entry on the break of it or 15 min risk entry within it.
GBP/USD Long
Minimum entry requirements:
• Corrective tap into area of value.
• 4H risk entry or 1H risk entry after 2 x 1H rejection candles.
Minimum entry requirements:
• Tap into area of value.
• 1H impulse up above area of value.
• If tight non-structured 5 min continuation follows, reduced risk entry on the break of it.
• If tight structured 5 min continuation follows, reduced risk entry on the break of it or 5 min risk entry within it.
• If tight non-structured 15 min continuation follows, 5 min risk entry within it if the continuation is structured on the 5 min chart or reduced risk entry on the break of it.
• If tight structured 15 min continuation follows, reduced risk entry on the break of it or 15 min risk entry within it.
AUD/USD Short
Minimum entry requirements:
• Break above area of value.
• 1H impulse down below area of interest.
• If tight non-structured 5 min continuation follows, reduced risk entry on the break of it.
• If tight structured 5 min continuation follows, reduced risk entry on the break of it or 5 min risk entry within it.
• If tight non-structured 15 min continuation follows, 5 min risk entry within it if the continuation is structured on the 5 min chart or reduced risk entry on the break of it.
• If tight structured 15 min continuation follows, reduced risk entry on the break of it or 15 min risk entry within it.
GBP/AUD Short
Minimum entry requirements:
• Corrective tap into area of value.
• 4H risk entry or 1H risk entry after 2 x 1H rejection candles.
Minimum entry requirements:
• Tap into area of value.
• 1H impulse down below area of value.
• If tight non-structured 5 min continuation follows, reduced risk entry on the break of it.
• If tight structured 5 min continuation follows, reduced risk entry on the break of it or 5 min risk entry within it.
• If tight non-structured 15 min continuation follows, 5 min risk entry within it if the continuation is structured on the 5 min chart or reduced risk entry on the break of it.
• If tight structured 15 min continuation follows, reduced risk entry on the break of it or 15 min risk entry within it.

Could the price bounce from here?GBP/AUD is falling towards the pivot which is an overlap support and could bounce to the 1st resistance which acts as an overlap resistance.
Pivot: 2.0624
1st Support: 2.0413
1st Resistance: 2.1029
Risk Warning:
Trading Forex and CFDs carries a high level of risk to your capital and you should only trade with money you can afford to lose. Trading Forex and CFDs may not be suitable for all investors, so please ensure that you fully understand the risks involved and seek independent advice if necessary.
Disclaimer:
The above opinions given constitute general market commentary, and do not constitute the opinion or advice of IC Markets or any form of personal or investment advice.
Any opinions, news, research, analyses, prices, other information, or links to third-party sites contained on this website are provided on an "as-is" basis, are intended only to be informative, is not an advice nor a recommendation, nor research, or a record of our trading prices, or an offer of, or solicitation for a transaction in any financial instrument and thus should not be treated as such. The information provided does not involve any specific investment objectives, financial situation and needs of any specific person who may receive it. Please be aware, that past performance is not a reliable indicator of future performance and/or results. Past Performance or Forward-looking scenarios based upon the reasonable beliefs of the third-party provider are not a guarantee of future performance. Actual results may differ materially from those anticipated in forward-looking or past performance statements. IC Markets makes no representation or warranty and assumes no liability as to the accuracy or completeness of the information provided, nor any loss arising from any investment based on a recommendation, forecast or any information supplied by any third-party.

Is GBPAUD Finally Ready to Drop?Price is currently struggling to break through a key resistance area. That’s not a problem – I’m not looking to catch the entire move, I only need a clean 1:3 RR and potentially the completion of the Asia range.
🔻 Bias: Bearish
On the 4H chart, I’ve identified the 50 EMA as a possible point of rejection, and it lines up perfectly with a 15m POI (Orderblock).
Since the Asia session opened higher, this creates a solid intraday short opportunity targeting the unfilled Asian range.
✅ I’ve marked two potential zones where price could react. If I get clean bearish price action in either zone – such as a BOS on the 1m or strong rejection patterns – I’ll look to execute the short.
Patience until the setup aligns. Let's see how it plays out. 🔍💯

GBPAUD I Your Next Long Opportunity in the UptrendWelcome back! Let me know your thoughts in the comments!
** GBPAUD Analysis - Listen to video!
We recommend that you keep this pair on your watchlist and enter when the entry criteria of your strategy is met.
Please support this idea with a LIKE and COMMENT if you find it useful and Click "Follow" on our profile if you'd like these trade ideas delivered straight to your email in the future.
Thanks for your continued support!Welcome back! Let me know your thoughts in the comments!

GBPAUD down ?I see this colorful butterfly pattern , let's see what market has prepared for us, but im hoping for GBP weakness today. At some point GBP has to break to downside, too much people have bought without being liquidated...
4.5 RRR
GL Traders
Not advice !!!

GBPAUD Is Going Up! Long!
Here is our detailed technical review for GBPAUD.
Time Frame: 1D
Current Trend: Bullish
Sentiment: Oversold (based on 7-period RSI)
Forecast: Bullish
The market is approaching a significant support area 2.091.
The underlined horizontal cluster clearly indicates a highly probable bullish movement with target 2.157 level.
P.S
Overbought describes a period of time where there has been a significant and consistent upward move in price over a period of time without much pullback.
Disclosure: I am part of Trade Nation's Influencer program and receive a monthly fee for using their TradingView charts in my analysis.
Like and subscribe and comment my ideas if you enjoy them!
