GBPAUD Scenario 2.1.2025In this market we can see sfp above high, so we can consider short positions, the condition for this is that the price must not break back above this support at price 2.0, if we break through, we can expect a reaction and continuation of the trend in bullish submission.
AUDGBP trade ideas

GBPAUD Channel Up pull-back expected.Our last GBPAUD signal (September 27 2024, see chart below) couldn't have gone any better as, not only did it hit our 1.92600 Sell Target but the price then also bounced to hit the top of its Channel Up:
The price is currently on a rejection path following the new Higher High of the Channel Up and based on the previous Bearish Leg, it should hit at least the 1D MA200 (orange trend-line). As a result, our Target is now 1.09600.
-------------------------------------------------------------------------------
** Please LIKE 👍, FOLLOW ✅, SHARE 🙌 and COMMENT ✍ if you enjoy this idea! Also share your ideas and charts in the comments section below! This is best way to keep it relevant, support us, keep the content here free and allow the idea to reach as many people as possible. **
-------------------------------------------------------------------------------
💸💸💸💸💸💸
👇 👇 👇 👇 👇 👇

GBPAUD short term sell into 1.97 (SEE DESCRIPTION)GBP/AUD has spent the last few days in the price range 2.033 -2.011.
The significance of this range is that is is an area of inefficient price delivery on the Buy-side of the market (see Monday 6th April 2020).
Once price reached that level, buyers who were only willing to do business at these levels now can price in their orders.
My trade idea is to those SELL to those willing buyers at a premium.
The failed higher high + the crack in correlation with EUR/AUD suggests that price has changed its state of delivery and now seeking key levels on the Sell-side of the market.
I look to sell at the first available retracement and cover my position (buy it back) at the short term lows at 1.97.

GBPAUD Selling Trading IdeaHello Traders
In This Chart GBP/AUD 4 HOURLY Forex Forecast By FOREX PLANET
today GBP/AUD analysis 👆
🟢This Chart includes_ (GBP/AUD market update)
🟢What is The Next Opportunity on GBP/AUD Market
🟢how to Enter to the Valid Entry With Assurance Profit
This CHART is For Trader's that Want to Improve Their Technical Analysis Skills and Their Trading By Understanding How To Analyze The Market Using Multiple Timeframes and Understanding The Bigger Picture on the Charts

GBPAUD Is Very Bullish! Buy!
Please, check our technical outlook for GBPAUD.
Time Frame: 8h
Current Trend: Bullish
Sentiment: Oversold (based on 7-period RSI)
Forecast: Bullish
The market is testing a major horizontal structure 1.995.
Taking into consideration the structure & trend analysis, I believe that the market will reach 2.010 level soon.
P.S
Overbought describes a period of time where there has been a significant and consistent upward move in price over a period of time without much pullback.
Like and subscribe and comment my ideas if you enjoy them!

GBPAUD My Opinion! BUY!
My dear subscribers,
This is my opinion on the GBPAUD next move:
The instrument tests an important psychological level 1.9965
Bias -Bullish
Technical Indicators: Supper Trend gives a precise Bullish signal, while Pivot Point HL predicts price changes and potential reversals in the market.
Target - 2.0110
My Stop Loss - 1.9905
About Used Indicators:
On the subsequent day, trading above the pivot point is thought to indicate ongoing bullish sentiment, while trading below the pivot point indicates bearish sentiment.
———————————
WISH YOU ALL LUCK

GBPAUD has entered in bearish phaseWith a broken trendline, no new HH, and a bearish flag pattern, these are the confluences that indicate the pair's bearish trend. A short entry can be taken on the flag's breakout. The projection of a bearish flag has also been marked on the chart


GBPAUD possible bullish movement GBPAUD is currently moving to the upside Note: Just a trade idea
Not a signal

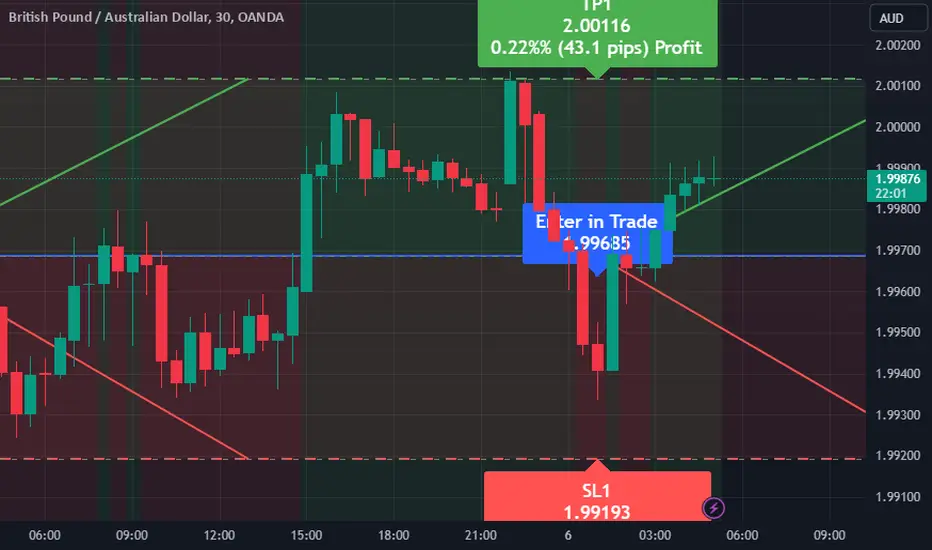
GBPAUD: Buy Signal for a Profitable MoveIn our latest analysis of the GBPAUD currency pair, we are leaning towards a bullish sentiment. With a suggested entry price of 1.99685, we are setting our eyes on a take profit level of 2.00116 while managing our risk with a stop loss at 1.99193.
This optimistic forecast is primarily driven by the current market dynamics observed through the EASY Trading AI strategy, which has shown strong bullish trends recently. The GBPAUD is benefiting from positive economic data from Australia while also capitalizing on the UK’s recovery efforts. Factors like improving economic indicators from the UK, combined with a resilient Australian dollar, support the upward movement we’re anticipating.
Moreover, technical analysis reveals a potential support area that aligns with our entry point, creating a solid foundation for our trade. As always, we recommend closely monitoring market conditions as price approach our targets. Don’t hesitate to adjust your strategies, and consider leveraging our EASY Bots for automated trading if manual oversight feels challenging.
Stay informed, trade wisely, and let's aim for those pips together!
GBPAUD SELL SETUPGA ended last week with a strong sell off forming a bearish engulfing on the daily and a break of structure here. On the retest there could be another opportunity to sell

GBPAUD Short on Regression BreakGBPAUD has broken the uptrend over the holiday period.
May need more time to develop a trend as volumes will return today.

GBPAUD 4hSL 2.0322
TP 1.9154
Price action is respecting the supply zone and we got a bearish impulse. I'm expecting now a short term downtrend with final target our demand zone.
It is possible to open multiple positions targeting different key levels.
Good trade everyone $$$

GBPAUD IS TO MAKE A RETRACEMENTGBPAUD- A divergence has shown and the price has just rejected the orderblock.... Fibo retracement is about to go... lets go people... Are You bullish this week?

Looking for a pullback to BuySimple price broke a high and I'm waiting for a pullback then take Buys.

Looking for a pullback to BuySimple price broke a high and I'm waiting for a pullback then take Buys.
