GBPAUD neutral - 9th July 2025This is my detailed multi-timeframe analysis for GBPAUD, based on the prevailing market structure, key liquidity zones, and candlestick behaviour.
Quarterly Timeframe:
On the three-month timeframe, price recently reached a significant liquidity region around 2.1600. From this level, the market has attracted substantial bearish orders, as evidenced by the recent quarterly candlestick, which closed relatively bearish. This suggests that bullish momentum has weakened considerably at these highs. Consequently, I expect that additional bearish orders may continue to enter the market, leading to a moderate retracement in the coming quarters.
Monthly Timeframe:
On the monthly chart, while price rejected the major liquidity region at 2.1600, the subsequent monthly candles have shown some signs of bullish intent, as indicated by wicks forming higher highs and higher lows. However, the candlestick bodies reveal an overall lack of follow-through, implying indecision in the market.
June’s monthly candle closed relatively bearish and indecisive, which may suggest that price is currently accumulating orders to fuel its next significant move. My current intuition leans towards a potential continuation higher, provided that price action confirms this bias. Notably, June’s candle could be interpreted as a potential order block, suggesting the possibility of price filling orders for a bullish move.
Nevertheless, the presence of a textbook ‘W’ formation must be acknowledged. The bearish close in June may imply a retest of the neckline around the 2.0300 level. Should bearish confirmations appear, this scenario could unfold in the medium term.
Weekly Timeframe:
The weekly timeframe indicates that price has been consolidating for the past five weeks. This choppy, indecisive price action makes the structure more challenging to interpret with conviction. The base of this consolidation zone sits around 2.0825; a clear weekly close below this level could present a case for bearish continuation, contingent on supporting confluences. At present, my bias on the weekly timeframe remains neutral given the lack of a clear directional signal.
Daily Timeframe:
On the daily chart, the market showed notable bearish activity in the previous session, closing below the key 2.0880 region. The next significant liquidity area to watch lies around 2.0700. My short-term bias for the day is bearish, and I anticipate that price may move towards this region. However, I do not regard this as a high-probability setup, so caution is warranted.
4-Hour Timeframe:
The 4-hour timeframe offers little additional clarity beyond the observation that price absorbed considerable bearish orders around the 2.0950 level. If price closes above the 2.0838 level, I will consider a short-term long position targeting the daily liquidity region at 2.0880. Overall, my stance on the 4-hour chart is largely neutral until more decisive price action emerges.
Disclaimer:
This analysis is intended for informational and educational purposes only. It does not constitute financial advice. Please conduct your own research and apply sound risk management before entering any trades.
AUDGBP trade ideas

Tap and goWe might see this guy tapping on that POI after taking out that previous low, then push up

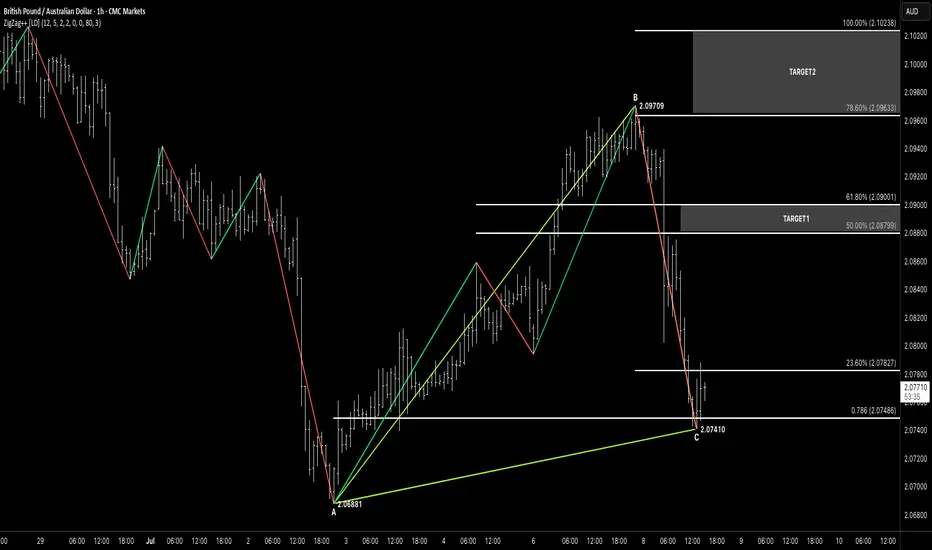
ABCHey traders, hope you’re crushing it this week! 🚀
Just spotted a clean ABC Bullish setup on the GBP/AUD 1-Hour chart. Here’s the breakdown:
🧠 Pattern Breakdown
A→B (Impulse Up): 2.06881 → 2.09709
B→C (Retrace Down): 2.09709 → 2.07410
Point C landed right on our rising A→C trendline and just under the 78.6% Fib of A→B (~2.07486)—double confluence!
✅ Why This Works
ABC Structure: Clear impulse then corrective leg into support
Trendline Support: A→C line guiding our C pivot
Fib Confluence: C sits in the 23.6%–78.6% zone of A→B (2.07827–2.07486)
⚔️ Trade Plan
Entry: Long after an hourly close above 2.07827 (23.6% level), ideally within 2.07827–2.07410 (PCZ)
Stop-Loss: Just below point C at 2.07410 (e.g. 2.07380)
Size: Keep risk sensible—1–2% of your account
🎯 Profit Targets
T1: 50% retrace of B→C → 2.08799 (take partial)
T2: 61.8% retrace → 2.09001
T3: 78.6% retrace → 2.09633–2.10238
🔍 Confirmation & Invalidation
Confirm: Look for a bullish pin-bar or engulfing candle closing above 2.07827 before entering
Invalidate: If price dips below 2.07410 (point C), scrap the idea—this setup needs that level to hold
💡 Keep It Simple:
ABC → PCZ → 23.6% close → Trigger → Ride.
Let the chart guide you, not your emotions, and watch for any GBP/AUD news for extra context.
Here’s to tight stops, smart entries, and smooth profits! ✌️
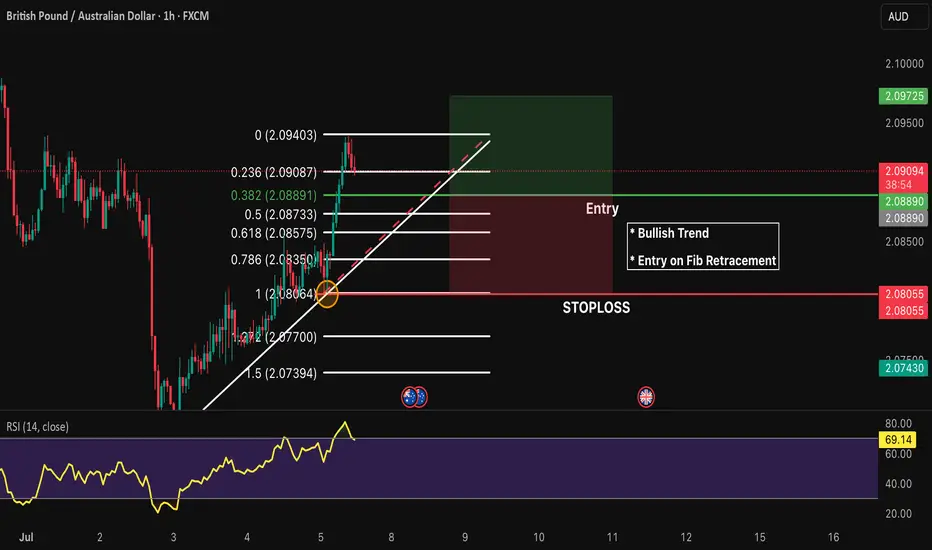
GBP/AUD Trade Setup – Short Bias📉 GBP/AUD Trade Setup – Short Bias
🕒 Timeframe: 1H
📍 Entry Zone: 2.09300–2.09400
🎯 Target Zone: 2.08400
🔍 Analysis:
Price is rejecting a key supply zone after a strong impulsive move. I'm anticipating a return to the previous demand area around 2.08400.
📌 Arrows indicate possible retracement entries within the supply zone for optimal short execution. Watch for bearish confirmation on LTF.
📲
#GBP #FXTrade #GBPUSD #SupplyAndDemand #PriceAction #ForexSignals #SellSetup

GBPAUD SHORTMarket structure bearish on HTFs DH
Entry at both Daily and Weekly Rejection
Weekly Rejection at AOi
Daily Rejection At AOi
Previous Structure point Daily
Around Psychological Level 2.09000
H4 Candlestick rejection
Rejection from Previous structure
Levels 4.22
Entry 95%
REMEMBER : Trading is a Game Of Probability
: Manage Your Risk
: Be Patient
: Every Moment Is Unique
: Rinse, Wash, Repeat!
: Christ is King.

GBPAUD 15/3 Pullback LongThere could be a double tops forming in progress. It could drop down to the two demand zones and get liquidity and fly up.
Also could be triple tops and pullback and fly.
Ultimate goal is long and reaching supply 2.09620 area


GBPAUD 15/3 Pullback LongOverall trend is long. Expecting a pull back to the demand zone and lift off. Waiting time...

GBPAUD sideways consolidation resistance at 2.1020The GBPAUD remains in a bullish trend, with recent price action showing signs of a corrective pullback within the broader uptrend.
Support Zone: 2.0800 – a key level from previous consolidation. Price is currently testing or approaching this level.
A bullish rebound from 2.0800 would confirm ongoing upside momentum, with potential targets at:
2.1020 – initial resistance
2.1160 – psychological and structural level
2.1310 – extended resistance on the longer-term chart
Bearish Scenario:
A confirmed break and daily close below 2.0800 would weaken the bullish outlook and suggest deeper downside risk toward:
2.0755 – minor support
2.0690 – stronger support and potential demand zone
Outlook:
Bullish bias remains intact while the GBPAUD holds above 2.0800. A sustained break below this level could shift momentum to the downside in the short term.
This communication is for informational purposes only and should not be viewed as any form of recommendation as to a particular course of action or as investment advice. It is not intended as an offer or solicitation for the purchase or sale of any financial instrument or as an official confirmation of any transaction. Opinions, estimates and assumptions expressed herein are made as of the date of this communication and are subject to change without notice. This communication has been prepared based upon information, including market prices, data and other information, believed to be reliable; however, Trade Nation does not warrant its completeness or accuracy. All market prices and market data contained in or attached to this communication are indicative and subject to change without notice.

GBPAUD .BEARISH TREND 4HR and Daily Chart Analaysis GBP/AUD is expected to enter a bearish phase for an extended period, potentially declining from the levels of 2.10074 – 2.08638. The next key support zone in this downtrend lies between 2.02569 and 2.01459, where a potential bullish reaction may occur. However, traders should approach this setup with caution, as it carries significant risk and is likely to unfold over a longer timeframe—possibly around a month

GBPAUD 4H Rocket Booster Strategy - Breakout MomentumGBPAUD 4H Rocket Boost Strategy – Strong Bullish Structure with EMA Support, Breakout Momentum, ADX Trend Power, and Stoch RSI Buy Signal
The GBPAUD currency pair has set up a compelling bullish scenario on the 4-hour chart, closely fitting the Rocket Boost
Strategy framework. This setup is a powerful combination of trend-following confirmation and momentum-based signals that
many experienced traders look for before entering high-probability trades.
1. Price Above the 50 EMA
GBPAUD is currently holding above the 50-period Exponential Moving Average, which shows short-term bullish control. This
EMA is often used to track immediate price direction, and when \
price consistently remains above it, it suggests strong buying
interest is supporting each pullback. Recent candles have respected the 50 EMA as dynamic support, indicating a solid
foundation for continued upside movement.
2. Price Above the 200 EMA
The 200 EMA is widely viewed as the "line in the sand" between
bullish and bearish bias on higher timeframes. With GBPAUD trading above this level, long-term sentiment confirms that the
market favors the bulls. The 50 EMA sitting above the 200 EMA
also forms a bullish stack, adding even more weight to the long
setup. This dual EMA alignment acts like a runway for bullish continuation.
3. Breakout Candles / Aggressive Price Action
Recent price movement shows a series of strong bullish candles with higher closes and minimal lower wicks. These breakout-style candles reflect aggressive buying, often seen when
institutional orders are flowing into the market. This type of behavior, especially when occurring above both EMAs, is
considered part of the Rocket Boost ignition point—a moment when price accelerates beyond previous resistance without hesitation.
4. ADX Indicator Confirms Trend Strength
The Average Directional Index (ADX) is showing rising values above the 20–25 zone, which signals that the current trend is not
only present but gaining strength. When price action and moving averages align with a rising ADX, it suggests that the trend has
the potential to continue with strong momentum. This increases
the confidence in the breakout being sustainable rather than a false move.
5. Stochastic RSI Generates Fresh Buy Signal
The Stochastic RSI recently moved from oversold levels and has now crossed upward, giving a fresh buy signal just as the
breakout begins. This timing is key—it tells us that momentum is turning in favor of the bulls just as the trend is gaining steam.
When this signal aligns with EMA structure and ADX confirmation, it often acts as a launch pad for the next leg up.
What This Means for GBPAUD Traders
With price trading above both EMAs, strong breakout candles forming, a rising ADX, and a bullish Stochastic RSI cross, the
GBPAUD pair is showing every characteristic of a classic Rocket Boost setup. Traders may want to monitor upcoming resistance
zones—especially previous swing highs and psychological levels—for potential targets.
If momentum continues and volume supports the move, we could see GBPAUD make a strong climb in the coming sessions.
Managing entries and exits around minor pullbacks, Fibonacci extensions, or intraday support zones can help optimize trade outcomes.
To learn more about this kind of setup, search for Rocket Booster Strategy content.
Disclaimer: This article is for educational purposes only and is not financial advice. Always perform your own analysis, and use risk management when trading.

GBPAUD 4H Rocket Booster Strategy – Strong Bullish Structure GBPAUD 4H Rocket Boost Strategy – Strong Bullish Structure with EMA Support, Breakout Momentum, ADX Trend Power, and Stoch RSI Buy Signal
The GBPAUD currency pair has set up a compelling bullish scenario on the 4-hour chart, closely fitting the Rocket Boost
Strategy framework. This setup is a powerful combination of trend-following confirmation and momentum-based signals that
many experienced traders look for before entering high-probability trades.
1. Price Above the 50 EMA
GBPAUD is currently holding above the 50-period Exponential Moving Average, which shows short-term bullish control. This
EMA is often used to track immediate price direction, and when \
price consistently remains above it, it suggests strong buying
interest is supporting each pullback. Recent candles have respected the 50 EMA as dynamic support, indicating a solid
foundation for continued upside movement.
2. Price Above the 200 EMA
The 200 EMA is widely viewed as the "line in the sand" between
bullish and bearish bias on higher timeframes. With GBPAUD trading above this level, long-term sentiment confirms that the
market favors the bulls. The 50 EMA sitting above the 200 EMA
also forms a bullish stack, adding even more weight to the long
setup. This dual EMA alignment acts like a runway for bullish continuation.
3. Breakout Candles / Aggressive Price Action
Recent price movement shows a series of strong bullish candles with higher closes and minimal lower wicks. These breakout-style candles reflect aggressive buying, often seen when
institutional orders are flowing into the market. This type of behavior, especially when occurring above both EMAs, is
considered part of the Rocket Boost ignition point—a moment when price accelerates beyond previous resistance without hesitation.
4. ADX Indicator Confirms Trend Strength
The Average Directional Index (ADX) is showing rising values above the 20–25 zone, which signals that the current trend is not
only present but gaining strength. When price action and moving averages align with a rising ADX, it suggests that the trend has
the potential to continue with strong momentum. This increases
the confidence in the breakout being sustainable rather than a false move.
5. Stochastic RSI Generates Fresh Buy Signal
The Stochastic RSI recently moved from oversold levels and has now crossed upward, giving a fresh buy signal just as the
breakout begins. This timing is key—it tells us that momentum is turning in favor of the bulls just as the trend is gaining steam.
When this signal aligns with EMA structure and ADX confirmation, it often acts as a launch pad for the next leg up.
What This Means for GBPAUD Traders
With price trading above both EMAs, strong breakout candles forming, a rising ADX, and a bullish Stochastic RSI cross, the
GBPAUD pair is showing every characteristic of a classic Rocket Boost setup. Traders may want to monitor upcoming resistance
zones—especially previous swing highs and psychological levels—for potential targets.
If momentum continues and volume supports the move, we could see GBPAUD make a strong climb in the coming sessions.
Managing entries and exits around minor pullbacks, Fibonacci extensions, or intraday support zones can help optimize trade outcomes.
To learn more about this kind of setup, search for Rocket Booster Strategy content.
Disclaimer: This article is for educational purposes only and is not financial advice. Always perform your own analysis, and use risk management when trading.

GBPAUD M15 - Bearish Setup Based on Divergence & Structure Break📉 GBPAUD M15 - Bearish Setup Based on Divergence & Structure Break 📉
Pair: GBPAUD
Timeframe: 15M
Strategy: Wave Analysis + Supply Zone + AO Divergence + Structure Break
⸻
🔍 Market Overview:
The current price action on GBP/AUD M15 reveals a 5-wave impulsive structure with clear signs of exhaustion at the top. Price recently tapped into a well-defined supply zone (2.08858 - 2.08710), showing bearish divergence on the Awesome Oscillator (AO) between Wave 3 and Wave 5, signaling potential reversal.
⸻
📌 Key Confluences for the Sell Setup:
1️⃣ Supply Zone (2.08858 - 2.08710):
Price has entered a strong area of previous rejection. Watch how price reacts here.
2️⃣ Bearish Divergence (AO):
• AO Histogram shows lower highs while price makes higher highs between Wave 3 and Wave 5.
• This is a classic bearish divergence—a potential early sign of trend reversal or deeper correction.
3️⃣ Break of Structure (2.08658):
A clean break below the minor structure support at 2.08658 will confirm weakness in bullish momentum and open the door for short opportunities.
4️⃣ Entry Confirmation:
• Wait for a clear M15 bearish candle close below 2.08658.
• Ideal confirmation would be a break-retest scenario, or a rejection wick back into the supply zone followed by bearish continuation.
⸻
🔽 Trade Plan (Sell Bias):
Entry Trigger: Break of 2.08658 structure
SL (Stop Loss): Above 2.08858 (Above Supply Zone / Wave 5 high)
TP1: 2.08250 (Recent minor support)
TP2: 2.07800 (Deeper correction area)
TP3: 2.07500 (Previous demand zone)
⸻
⚠️ Risk Management & Notes:
• Risk-reward ratio: Aim for at least 1:2 to 1:3 depending on entry.
• Avoid premature entries before structure is broken.
• Be cautious of news impact around AUD/GBP (as marked on chart).
⸻
📎 Conclusion:
A clean divergence setup has formed near a supply zone, with signs of bullish momentum fading. If structure breaks, this could be a high-probability short setup. Always wait for confirmation and manage risk properly.
⸻
💬 Feel free to like, comment, or share your views below. Good luck and safe trading! 🚀
#GBPAUD #PriceAction #WaveAnalysis #SupplyZone #Divergence #AO #BearishSetup #StructureBreak #ForexAnalysis #M15Setup #TradingView

An Inverted head and shoulder pattern gives opportunity-ForexBDAn inverted head and shoulders pattern has formed on the GBPAUD D-1 timeframe. The market has formed a second shoulder, so if the price goes up and breaks the neckline or resistance line, the market will go into an uptrend.
⭕️Risk Warning : Trading on financial markets carries risks!
©FXBD Official Team

GBP/AUD - short- 4H and 1H looks bearish
- entry at 15 mins (atleast 3R): price will go down to 1H demand before going up
GBPAUD Selling Trading IdeaHello Traders
In This Chart GBP/AUD 4 HOURLY Forex Forecast By FOREX PLANET
today GBP/AUD analysis 👆
🟢This Chart includes_ (GBP/AUD market update)
🟢What is The Next Opportunity on GBP/AUD Market
🟢how to Enter to the Valid Entry With Assurance Profit
This CHART is For Trader's that Want to Improve Their Technical Analysis Skills and Their Trading By Understanding How To Analyze The Market Using Multiple Timeframes and Understanding The Bigger Picture on the Charts

Gbp/aud possible sniper sell ????Looking at the 1 hr chart I'm seeing a possibility of a pullback trade at the current level of 2.08274 my reasons are a few i can see a lot of negative volume at a poi level of resistance mixed in with a twist of liquidity grab , and a pinch of creative double top forming let's see how this trade pans out , if it breaks and holds a solid 1hr candle upwards past 2.08522 its a stop loss 😤, if it continues a 1 hr candle down its game on down to around 2.068 area


GBP_AUD BEARISH BIAS|SHORT|
✅GBP_AUD is going up to retest
A horizontal resistance of 2.0892
Which makes me locally bearish biased
And I think that we will see a pullback
And a move down from the level
Towards the target below at 2.0805
SHORT🔥
✅Like and subscribe to never miss a new idea!✅
Disclosure: I am part of Trade Nation's Influencer program and receive a monthly fee for using their TradingView charts in my analysis.

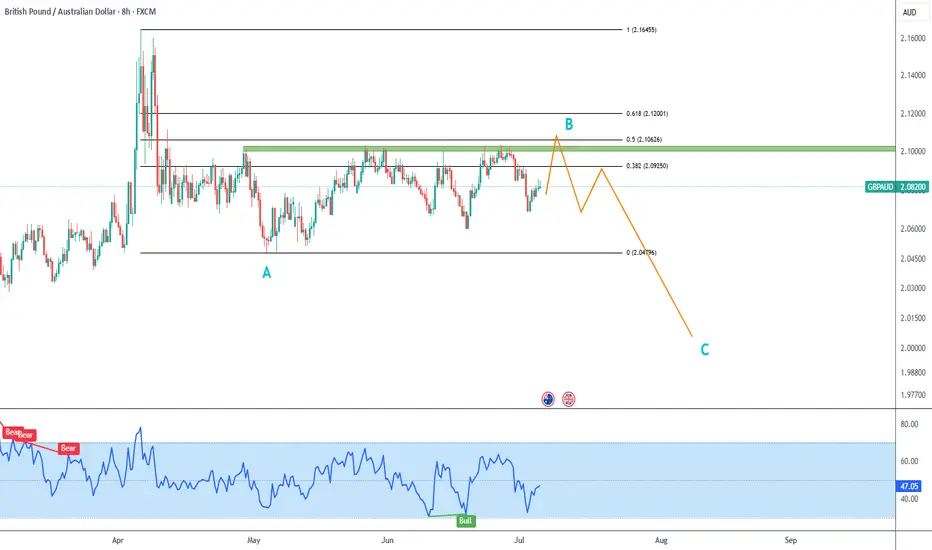
GBPAUD Trade Plan
I am considering we are currently inside blue B corrective wave, and expect further downside for blue C.
Wave B could be finished, but I´d prefer to see a liquidity sweep targeting 50% pullback, and dropping right back below the green resistance zone.
This would be a great place to enter a short trade.
GBP-AUD Short From Resistance! Sell!
Hello,Traders!
GBP-AUD made a retest of
The horizontal resistance
Around 2.0800 from where
We will be expecting a
Local bearish move down
Sell!
Comment and subscribe to help us grow!
Check out other forecasts below too!
Disclosure: I am part of Trade Nation's Influencer program and receive a monthly fee for using their TradingView charts in my analysis.

GBPAUD ENTRY CHARTOn this Pair, we are still BEARISH, as TREND is Obviously still DOWN, also in our Intra-day trend, We are having BOS to the Down-side, we took our based of FVG confirmation with our MA+ Zones with our Additional Confluences, If this matches with your idea, you can look to join us, with a Good Risk Management, Thank You.
