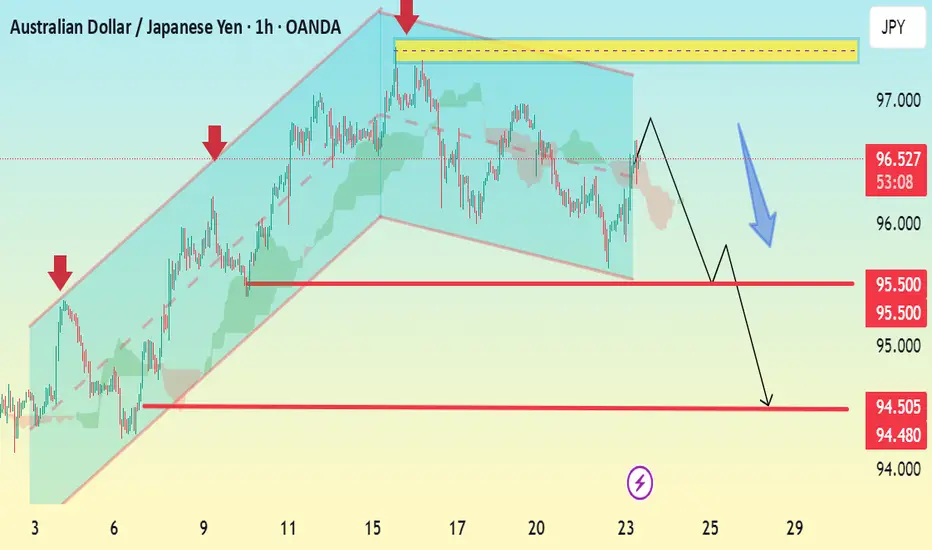
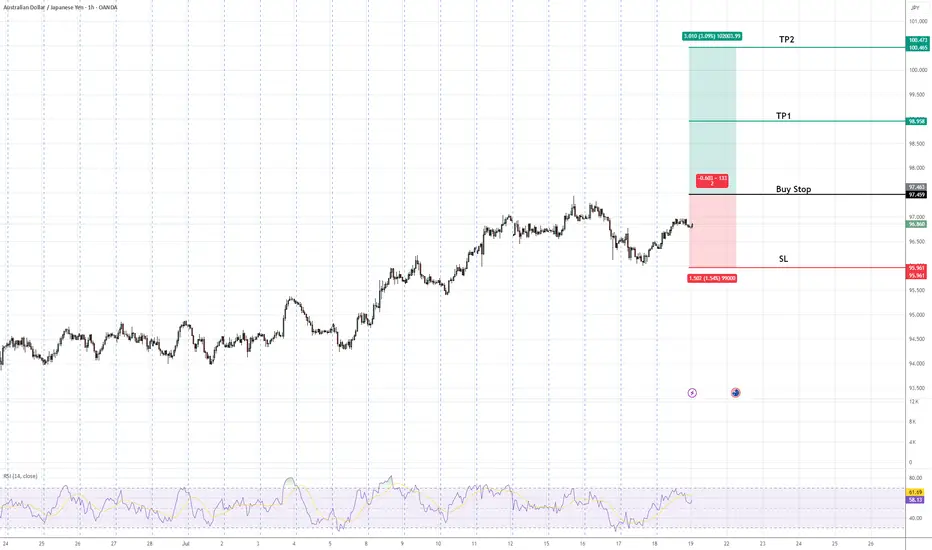
AUD/JPY 1H Bearish Reversal Setup Analysis:The chart shows a clear ascending channel that has now been broken to the downside, signaling a bearish breakout.
Price recently tested the upper boundary near 97.00 and faced rejection.
The break below the channel support and the projection with a blue arrow suggest a trend reversal.
Multiple support levels are marked, indicating potential take-profit zones.
Key Levels:
Resistance: 97.00
Immediate Support: 95.50
Target 1 (TP1): 95.00
Target 2 (TP2): 94.50 – 94.48
Bias: Bearish
Confirmation: Watch for a clean break below 95.50 to confirm further downside momentum.
AUDJPY trade ideas
AUDJPY BullishAfter exiting a correction, the first impulse (Wave 1) appears. I expect a retracement of at least 50% of the Fibonacci.

AUDJPY: Strong Bearish Signal?! 🇦🇺🇯🇵
AUDJPY may retrace from a key daily resistance.
As a confirmation, I see a bearish breakout of a support line of a rising
wedge pattern with a high momentum bearish candle.
Goal - 96.47
❤️Please, support my work with like, thank you!❤️
I am part of Trade Nation's Influencer program and receive a monthly fee for using their TradingView charts in my analysis.

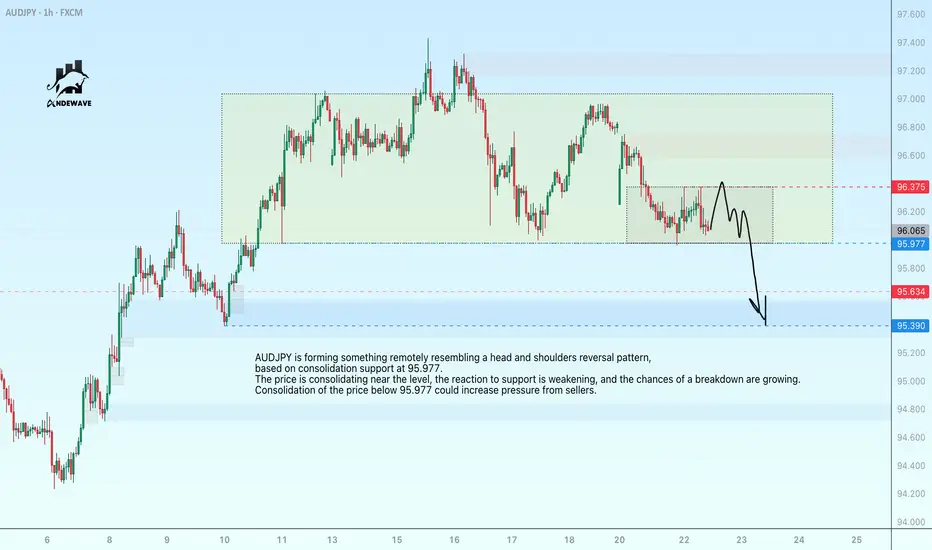
AUDJPY may reverse its upward trendAUDJPY is forming something remotely resembling a head and shoulders reversal pattern, based on consolidation support at 95.977. The price is consolidating near the level, the reaction to support is weakening, and the chances of a breakdown are growing. Consolidation of the price below 95.977 could increase pressure from sellers.
In addition, the fall of the dollar is causing the Japanese yen to strengthen, which could lead to a fall in the AUDJPY currency pair.
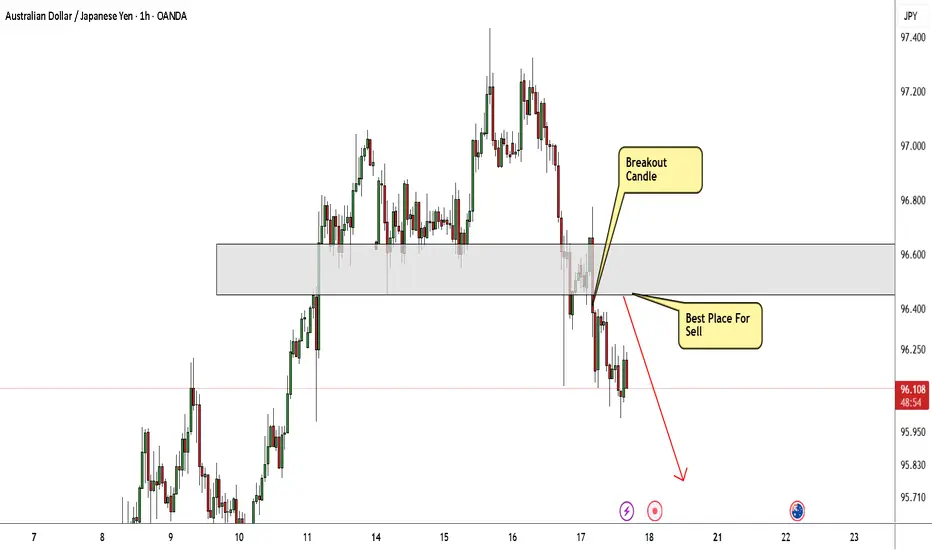
AUD/JPY Finally Decided To Go Down , Don`t Miss This 150 Pips !Here is my 1H Chart on AUD/JPY , And my opinion is we have a very clear breakout and the price will go down a little to make a retracement after this huge movement to upside without any correction , so i`, waiting the price to retest my broken supp and new Res and then we can enter a sell trade and targeting 100 : 150 pips . if the price go up again and closed above my res area with daily candle then this idea will not be valid anymore.
SHORT AUDJPYsell audjpy and target tp 1 at 100% fib level. like i said in my previous chfjpy post that they all had similar movement

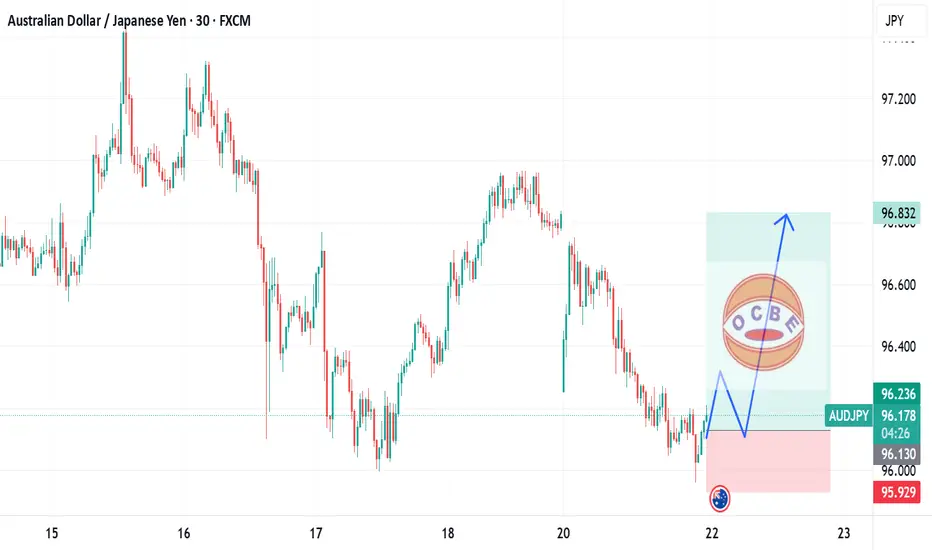
AUDJPY long movePrice had reached our demand zone and reacted bullishly and hence price cloud continues to move upward from the current level.
idealistic trade of usdchfsharing my insights of the trade that im holding .....hopefull this will educate lot of people out the ....................

CONFLUENCE will increase the PROBABILITY of your TRADEif you find enough confluence/reasons to take a trade and there isn't too much opposing data then you have a high probability trade. BUT you MUST know what you're looking for in order to build confluence. This vid will help you

AUDJPY BEARISHTechnically:
AUDJPY printed bearish divergence
AUDJPY broke LL
AUDJPY respecting bearish trendline
AUDJPY retrace which is new LH

AUDJPY: Waiting to BUYIn this video I walk through my full thought process on how I plan to approach this setup. I’m not rushing in or trying to predict what price will do. Instead, I’m staying reactive. I’ve identified a clean FVG that price is currently approaching, and my plan is to wait patiently for price to tap into that zone.
But tapping the FVG alone is not enough for me to jump in. What I really want to see is a clear bullish reaction, something like a strong bullish engulfing candle or a shift in structure that confirms the buyers are stepping in. If that happens, then I’ll look to take a long position targeting another liquidy zone.
This isn’t about guessing the bottom. It’s about letting price tell the story and only acting when there’s a clear signal. That’s the discipline behind this trade.

Aussie vs Yen: Setup for a Clean Long Robbery💣AUD/JPY Forex Heist: Aussie vs Yen 🔥Master Robbery Plan Unfolded!
🌟Hi! Hola! Ola! Bonjour! Hallo! Marhaba!🌟
Dear Money Makers, Bandits & Chart Pirates 🤑💰💸✈️
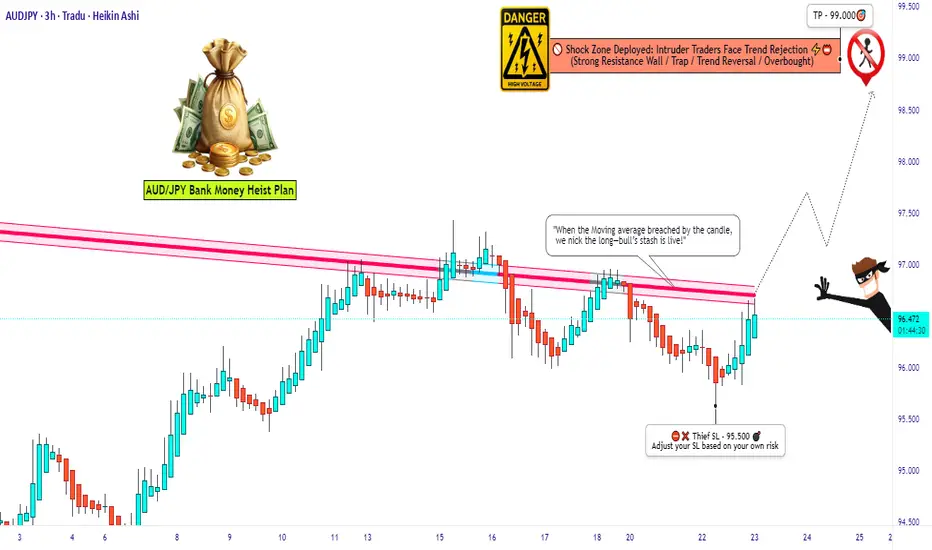
It's time to reload your gear and lock in the blueprint. Based on our 🔥Thief Trader Technical + Fundamental Intelligence🔥, we’re all set to ambush the AUD/JPY "Aussie vs Yen" battlefield. This ain’t no casual walk—it’s a full-scale market operation targeting the High Voltage Reversal Trap Zone⚡. The pressure is real: Overbought, Tricky Consolidation, and Bears camping at resistance. Your job? Steal profits before they smell the breakout! 🏆💪💵
🎯 Entry Point — "Let the Heist Begin"
🗝 Entry Level: Wait for the Breakout @ 94.500. When price shatters the Moving Average ceiling—that's your greenlight!
🚀 Execution Choices:
Place Buy Stop above the breakout point
Or, use Buy Limit Orders near recent swing highs/lows on the 15/30-min chart using Layering/DCA tactics (that’s how the real thieves sneak in 🕶️).
🔔 Set an alert to stay sharp—don’t miss the vault crackin’ open!
🛑 Stop Loss — “Cover Your Escape”
🎯 SL Level: Just under the recent swing low on the 3H timeframe (around 95.500)
🚫 Never place the SL before the breakout confirms! Let the move prove itself first.
🧠 SL sizing depends on your capital, lot size, and number of entries stacked. You control the risk, not the other way around!
🎯 Target — "Cash Out or Vanish"
💎 First Take-Profit: 99.000
🚪Optional Escape: Secure the bag early if momentum fades. Better leave rich than be late!
👀 For Scalpers & Swing Robbers Alike
🔍 Scalpers: Only ride the Long wave.
💼 Big pockets? Hit straight entry.
👟 Small capital? Tag in with swing trades and trail that SL like a pro.
🎣 Use a Trailing SL to lock profits as price sprints toward resistance.
📰 The Bigger Picture: Why AUD/JPY?
The pair is pumped by:
📈 Macro Economics
📊 Quant Analysis
📰 COT Reports
📉 Intermarket Correlations
🧠 Sentiment Heatmaps
🔥 Future Price Dynamics
Don’t pull the trigger blind. Read the battlefield before charging in.
⚠️ Thief’s Caution Zone: News Traps Ahead
🛎 News = chaos.
📌 Avoid entering fresh trades during major data drops.
🔐 Use Trailing SLs to protect ongoing plays.
📉 Let the market dance, but you control the music.
💥Hit the Boost Button!💥
If this heist plan pumps your portfolio, smash that boost. That’s how we fund more blueprints, fuel the Thief Gang’s vault, and keep the robbery cycle alive.
🤑💵 Together, let’s rob this market clean—Thief Style.
New plan drops soon. Stay locked. Stay sharp. Stay profitable.
🧠💰🏴☠️
— Thief Trader Out 🐱👤🔓🚀
AUDJPY Q3 | D21 | W30 | Y25📊AUDJPY Q3 | D21 | W30 | Y25
Daily Forecast 🔍📅
Here’s a short diagnosis of the current chart setup 🧠📈
Higher time frame order blocks have been identified — these are our patient points of interest 🎯🧭.
It’s crucial to wait for a confirmed break of structure 🧱✅ before forming a directional bias.
This keeps us disciplined and aligned with what price action is truly telling us.
📈 Risk Management Protocols
🔑 Core principles:
Max 1% risk per trade
Only execute at pre-identified levels
Use alerts, not emotion
Stick to your RR plan — minimum 1:2
🧠 You’re not paid for how many trades you take, you’re paid for how well you manage risk.
🧠 Weekly FRGNT Insight
"Trade what the market gives, not what your ego wants."
Stay mechanical. Stay focused. Let the probabilities work.
FRGNT 📊

AUDJPY Wave Analysis – 23 July 2025- AUDJPY reversed from support zone
- Likely to rise to resistance level 97.40
AUDJPY currency pair recently reversed up from the support zone located between the pivotal support level 95.55 (former monthly high from March and May), 20-day moving average and support trendline of the daily up channel from May.
This support zone was further strengthened by the 38.2% Fibonacci correction of the upward impulse from June.
AUDJPY currency pair can be expected to rise to the next resistance level 97.40, former monthly high from February, which also stopped the earlier impulse wave earlier this month.

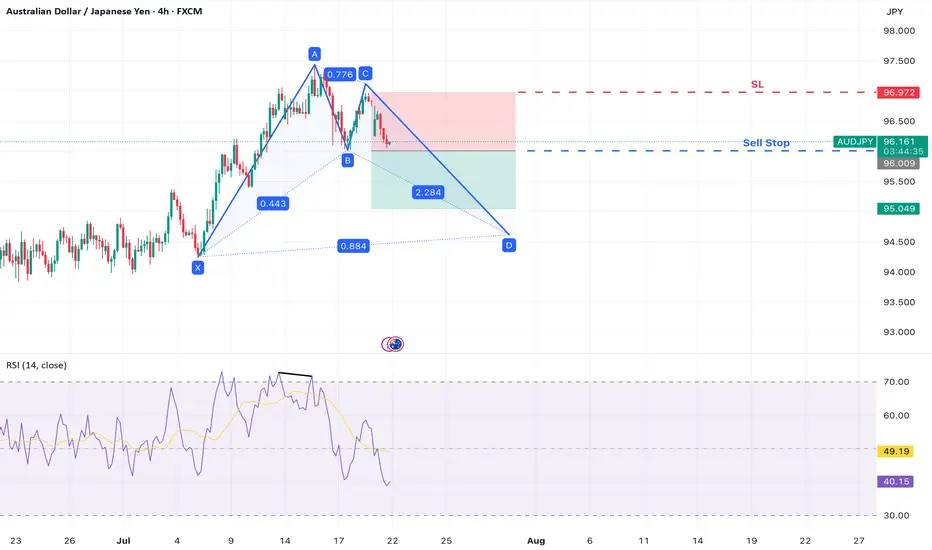
AUD/JPY – Bearish Move Within Bullish Bat StructureAUD/JPY is developing a Bullish Bat harmonic pattern on the 4-hour chart . While the full pattern has not yet completed, a potential short-term bearish opportunity is emerging as the pair begins forming the CD leg.
A clear b earish divergence on the RSI at Point A suggests waning bullish momentum, and a break below Point B may confirm the start of the final leg down toward Point D , completing the harmonic structure.
Trade Setup
Sell Stop Entry: 96.009 (break of Point B – confirms CD leg underway)
Stop Loss: 96.978 (above Point C – invalidates CD leg projection)
Take Profit 1: 95.040 (1:1 risk-to-reward level)
AUD-JPY Will Grow! Buy!
Hello,Traders!
AUD-JPY already made a
Bullish rebound from the
Strong horizontal support
Of 95.610 and as we are
Bullish biased we will be
Expecting a further bullish
Move up
Buy!
Comment and subscribe to help us grow!
Check out other forecasts below too!
Disclosure: I am part of Trade Nation's Influencer program and receive a monthly fee for using their TradingView charts in my analysis.

AUDJPY: Bullish Structure Shift Signals Institutional Buy ZoneGreetings Traders,
In today’s analysis of AUDJPY, we observe a recent bullish market structure shift (MSS), signaling potential for continued upward movement. With this in mind, we aim to capitalize on buying opportunities at key institutional points of interest to target higher premium prices.
Higher Timeframe Context:
The weekly timeframe maintains a clear bullish narrative. This long-term bias is now supported by a bullish MSS on the H4 timeframe, offering strong confluence and alignment across both macro and intermediate structures. This increases our confidence in expecting further bullish continuation.
Key Observations on H4:
Weekly Fair Value Gap (FVG) Support: Price recently pulled back into a weekly FVG and has rebalanced that inefficiency. This reaction aligns with the H4 MSS, reinforcing the weekly FVG as a strong institutional support zone.
Reclaimed Bullish Order Block: After the MSS, price retraced into a bullish reclaimed order block—an area where previous institutional positioning occurred. Since price has now reclaimed this level, it becomes a high-probability zone for renewed buying interest in the direction of the dominant trend.
Lower Timeframe Confirmation: This reclaimed order block will serve as our primary zone of interest to seek confirmations on the lower timeframes for precise entries.
Trading Plan:
Entry Strategy: Wait for bullish confirmation within the reclaimed H4 order block zone before entering long positions.
Target: The primary objective is the H4 liquidity pool situated at premium prices, which the market is likely to be drawn toward.
For a detailed market walkthrough and in-depth execution zones, be sure to watch this week’s Forex Market Breakdown:
As always, execute with discipline and align your trade management with your overall plan.
Kind Regards,
The Architect 🏛️📈

AUDJPY Buy Stop Setup | Trend Continuation in FocusAUDJPY is in an established uptrend, forming higher highs and higher lows. A buy stop is positioned above the recent swing high to confirm bullish continuation. The setup includes a defined stop-loss below the previous higher low to manage risk and two target profit levels (TP1 & TP2) aligned with key resistance zones. This approach favors trend-following traders seeking confirmation of upward momentum before entry.
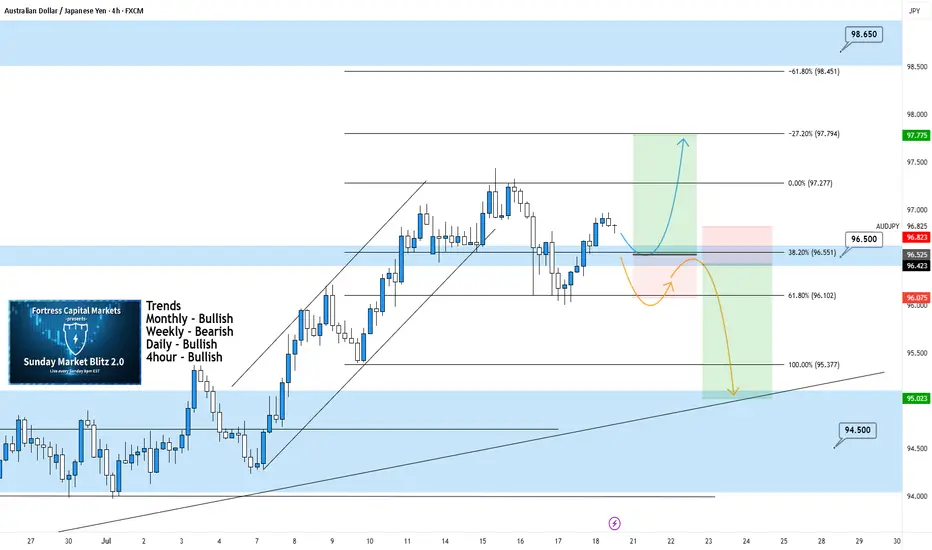
AUDJPY 4Hour TF - July 20th,2025AUDJPY 7/20/2025
AUDJPY 4hour Bullish Idea
Monthly - Bullish
Weekly - Bearish
Dailly - Bullish
4hour - Bullish
We’re looking mostly bullish on AJ going into this week but will this 96.500 hold as support? Let’s take a look at two potential scenarios for the week ahead:
Bullish Continuation - This is the most likely for AU this week according to the trends in play. For us to get confident in long scenarios, we would like to see strong bullish rejection from support around 96.500. If this happens look to target higher toward our negative fib levels and key resistance.
Bearish Reversal - For us to consider AJ bearish for the week, we would need to see some bearish pressure step in and push us below 96.500. If this happens we only need confirmation in the form of a lower high below 96.500.
Look to target lower toward major support levels like 94.500 area if this happens.
AUDJPY Q3 | D24 | W30 | Y25📊AUDJPY Q3 | D24 | W30 | Y25
Daily Forecast🔍📅
Here’s a short diagnosis of the current chart setup 🧠📈
Higher time frame order blocks have been identified — these are our patient points of interest 🎯🧭.
It’s crucial to wait for a confirmed break of structure 🧱✅ before forming a directional bias.
This keeps us disciplined and aligned with what price action is truly telling us.
📈 Risk Management Protocols
🔑 Core principles:
Max 1% risk per trade
Only execute at pre-identified levels
Use alerts, not emotion
Stick to your RR plan — minimum 1:2
🧠 You’re not paid for how many trades you take, you’re paid for how well you manage risk.
🧠 Weekly FRGNT Insight
"Trade what the market gives, not what your ego wants."
Stay mechanical. Stay focused. Let the probabilities work.
FRGNT

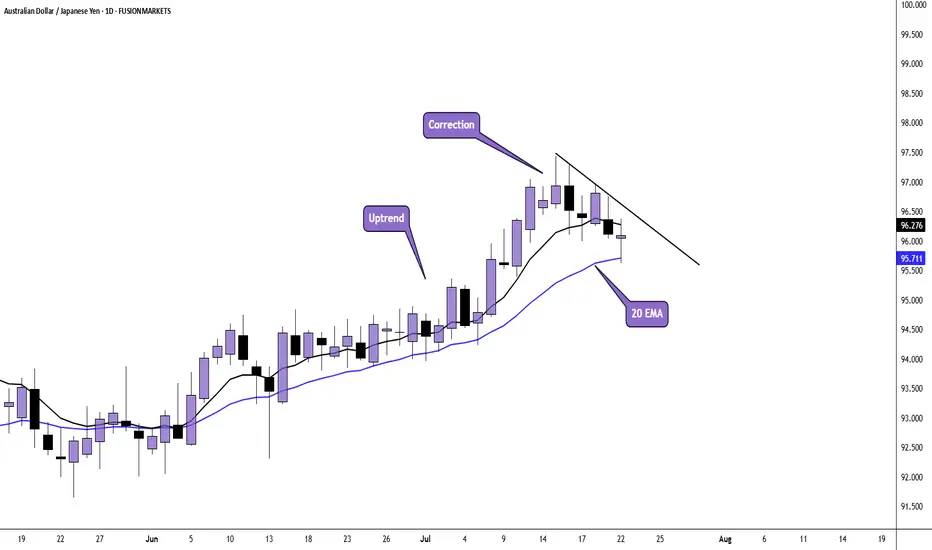
AUD/JPY Daily AnalysisPrice is in a daily uptrend and has pulled back to the 20 EMA.
Price may find support here and could see the next bullish impulse.
Wait for the breakout and a buy setup that meets your strategy rules if you agree.
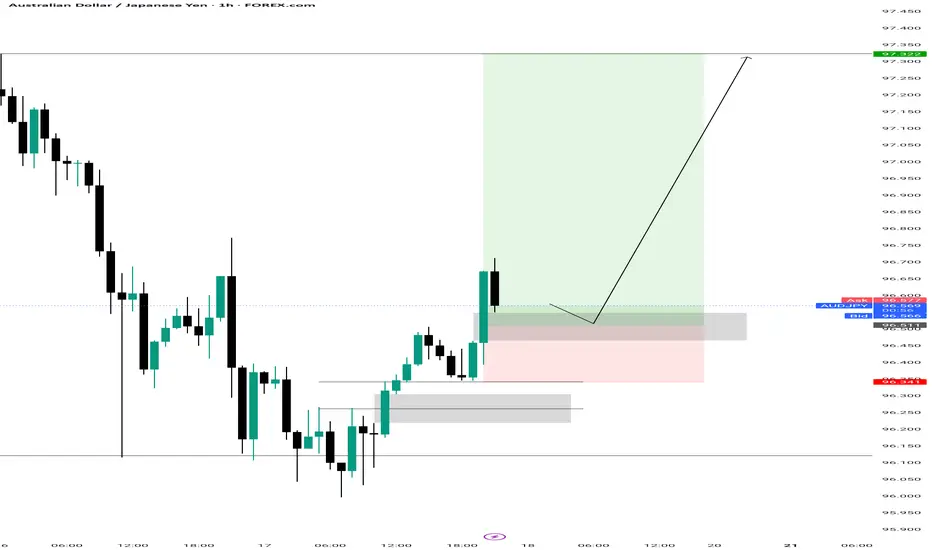
AUDJPY in Uptrend ContinuationBuy Limit
Entry Price 96.684
Stop Loss 96.446
Risk 1%
Lot Size 1.56
TP (1RR) 96.922
TP (3.2RR) 97.440