AUDJPY: H4, H1 Forecasts, Technical Analysis & Trading IdeaTechnical analysis is on the chart!
No description needed!
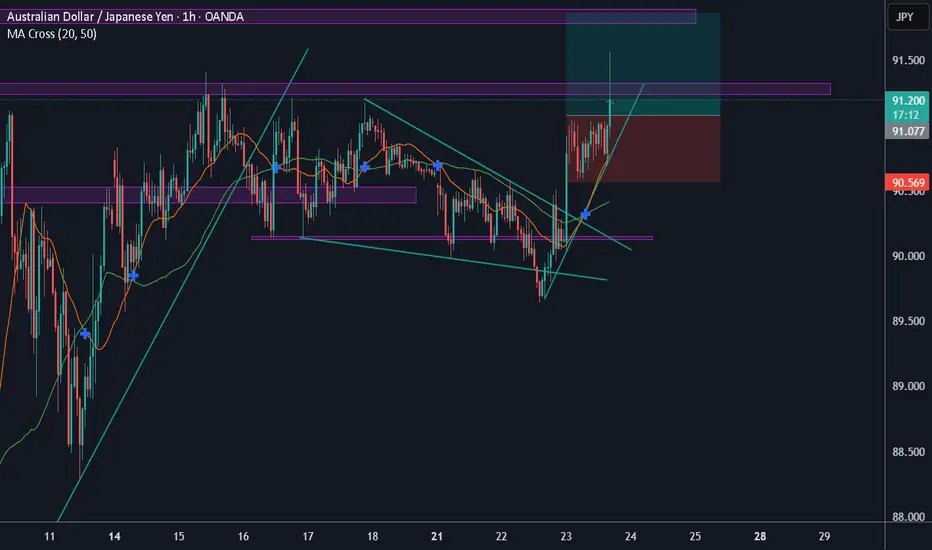
OANDA:AUDJPY
________________________________________________________________
❤️ If you find this helpful and want more FREE forecasts in TradingView,
. . . . . . . . Hit the 'BOOST' button 👍
. . . . . . . . . . . Drop some feedback in the comments below! (e.g., What did you find most useful? How can we improve?)
🙏 Your support is appreciated!
Now, it's your turn!
Be sure to leave a comment; let us know how you see this opportunity and forecast.
Have a successful week,
ForecastCity Support Team
AUDJPY trade ideas

AUD/JPY Pulls Back Ahead of 50-Day SMAAUD/JPY appears to be pulling back ahead of the 50-Day SMA (92.76) as it extends the decline from the start of the week.
In turn, AUD/JPY may track the negative slope in the moving average as it struggles to hold above the 91.50 (61.8% Fibonacci retracement) to 91.70 (38.2% Fibonacci extension) region, with a break/close below 90.50 (61.8% Fibonacci extension) raising the scope for a move towards 89.20 (61.8% Fibonacci extension).
Next area of interest comes in around 0.8660 (78.6% Fibonacci retracement) to 0.8740 (78.6% Fibonacci extension), but AUD/JPY may attempt to further retrace the decline from the monthly high (95.32) should it hold above 90.50 (61.8% Fibonacci extension).
Need a break/close above the 92.80 (50% Fibonacci extension) to 93.30 (23.6% Fibonacci extension) zone to bring the 95.10 (38.2% Fibonacci extension) to 95.20 (23.6% Fibonacci extension) region on the radar, with the next area of interest coming in around the March high (95.75).
--- Written by David Song, Senior Strategist at FOREX.com

AUDJPY bearish move| 🔹 Pair / TF | AUD/JPY, 4 h → Lower Timeframes |
| 🔹 Bias | Bearish (selling potential resistance) |
1. 📊 Key Levels
* Level: 93.317
* Role: Recent Swing High / Potential Resistance
* Level: 93.664
* Role: Higher Potential Resistance (aligned with a moving average)
* Level: ~92.317 (red shaded zone)
* Role: Broken Support – now potential resistance
* Level: ~91.109
* Role: Potential Support
* Level: ~90.011
* Role: Lower Potential Support
2. 🚨 Trigger
* Price is currently within the ~92.317 red shaded zone, which acted as minor support previously.
* There's a confluence with what appears to be a moving average (blue line) acting as dynamic resistance above this zone.
* **A rejection from this zone, confirmed by bearish price action on lower timeframes, would be the trigger.**
3. ✅ Confirmation
* Look for **bearish engulfing patterns or pin bars** forming on lower timeframes (e.g., 1h, 15m) within the ~92.317 zone.
* The Relative Strength Index (RSI) on the lower timeframe chart (shown at the bottom) is currently trending downwards and has broken a minor upward trendline (red line drawn on the RSI). **A continued downward trajectory below the 50 level would add confirmation.**
* **No significant bullish divergence visible on the RSI** that would suggest a reversal.
4. 🎯 Entry & Stops
| 🔶 Entry Zone | ~92.317 – ~92.200 (within the broken support now resistance zone) |
| 🔴 Stop-Loss | Above the recent swing high at 93.317 (potentially around 93.400 - 93.500 to allow for some wiggle room) |
* Place a **Sell Limit or Sell Stop order** within the entry zone, depending on your preferred entry style and confirmation.
* **Risk:** Determine your position size based on your risk tolerance and the calculated stop-loss in pips.
5. 🎯 Profit Targets
| Target | Level | Pips (approximate) | RRR |
| :----- | :-------- | :----------------- | :--------- |
| T1 | S1 ~91.109 | ~120-130 | 1 : 1 or better |
| T2 | S2 ~90.011 | ~220-230 | 1 : 2 or better |
* **Scale out:**
* Consider taking partial profits at T1.
* Let the remaining position run towards T2, potentially adjusting your stop-loss to breakeven or in profit.
6. ⚙️ Trade Management
* Once the trade is in profit (e.g., reaching a certain pip gain or T1), **consider moving your stop-loss to breakeven** to protect your capital.
* **Monitor price action around S1.** If there are strong signs of buying pressure, consider closing the remaining position.
* Pay attention to any potential reversal patterns or significant volume spikes as price approaches your target levels.
7. 🔑 Rationale
* The **break of the previous minor support around ~92.317 suggests a potential shift in momentum from bullish to bearish.**
* The **confluence of this broken support with a dynamic moving average resistance increases the probability of a rejection.**
* The **bearish momentum indicated by the RSI on the lower timeframe supports the short bias.**
* Aiming for the next support levels (S1 and S2) provides logical profit targets based on potential price action.
⚡ Highlight:
This is a **bank-order-flow style fade**, looking to sell at a level that previously acted as support, now likely to act as resistance after a break, with confluence from a moving average. The lower timeframe RSI breakdown adds to the bearish conviction.

AUDJPY SELL Overall AUDJPY is currently in a Bearish trend. Price action on the 1hr chart just recently broken a Bullish trendline to the downside. On the lower time frame (3 minute) there was a bearish change of character and break of structure and price is currently below the 200ema. Market execution sell with SL at recent high.

AUDJPYLooking for price to reach 91.95 or higher in the future. The daily target range is a nice area dating back towards 2022. Price is at a support zone and there may be divergence on the daily money flow index.

Short A/JPrice has just retested previous support, where align with the 618% Fib, and also a descending trendline. The over all trend is bearish and the current set up is a triangle on the 1hr timframe. Entry break an retest and target yellow line.

AUDJPY: B+ tradeA page from my trading journal. Please take it with a grain of salt, as I’m still learning and growing 🌟
Overextended to top of rising channel, RSI divergence rising. Needs reversal bar confirmation (e.g. failed breakout + bear close).
This setup is solid if Tokyo fails to push higher or we get a micro double top. We want to catch the reversal from exhaustion, not momentum.
Bullish trend-line, so enter short with caution

AUDJPY Breakout: Can the Rally Continue?AUDJPY Breakout: Can the Rally Continue?
Last week, AUDJPY broke out of a bullish triangle, signaling a potential upward move. The Japanese yen has been influenced by concerns over the country's economy, particularly the impact of tariffs, which may be affecting its strength.
So far, the breakout appears solid, increasing the chances for AUDJPY to rise further. The first resistance level is near 93.10, while the second key resistance is around 95.00. In both areas, the price could struggle to break through due to strong historical resistance from previous market structures on the left side of the chart.
You may find more details in the chart!
Thank you and Good Luck!
❤️PS: Please support with a like or comment if you find this analysis useful for your trading day❤️
Disclosure: I am part of Trade Nation's Influencer program and receive a monthly fee for using their TradingView charts in my analysis.

AUDJPY TRADE SETUPWait for retest the entry level then take a trade for Buy otherwise skip this setup

AUDJPY: Price Action & Swing Analysis
The analysis of the AUDJPY chart clearly shows us that the pair is finally about to tank due to the rising pressure from the sellers.
Disclosure: I am part of Trade Nation's Influencer program and receive a monthly fee for using their TradingView charts in my analysis.
❤️ Please, support our work with like & comment! ❤️

Selling AUDJPY on the daily timeframe the price has retraced back into the resistance area and showing us loss in buying pressure momentum

AUDJPY SELLING FROM THE FVG, a point of reference An obvious sell when the FVG is hit,
Following a break of structural BOS which the market didn't go back to the reference point, we wait for the market to go to that reference point so we can make our trade from there

LONG....BAJ @ 91.61just executed long... BAJ @ 91.61
💯 solid setup...watch this takeoff 🛫
expecting min DD max RRR till Friday NYC...
TP1 and SL as shown until final TP2 projected by system.
Sorry, alert is not based on TA or BOS or OB or ICT....rather based on multi-system confluence convergence and confirmations....
now system beeping let's test n see 🙈
appreciate any feedback for continuous improvement.
🥂

AUDJPY Potential Swing Setup – Can You See What It's Building?AUDJPY has been forming a super clean structure on the daily chart lately
Price is now pulling back into a key breakout zone, and reacting strongly—
right at the golden observation zone where reversals tend to happen.✨
👊 Here’s what we do every day:
We’re not aiming to win every trade, but we make sure every setup is backed by logic.
We focus solely on perfect timing for entries—and let our custom trade tools handle the exits automatically. 🛠️
We enter with a short-term mindset to catch medium-term swing plays—only taking trades with strong risk-reward. 📈
This isn’t just a strategy—it’s the mindset of a professional trader.

AUDJPY INTRADAY important resistance retest at 91.85The AUDJPY currency pair remains in a bearish trend, with the recent price action showing signs of an oversold bounce. While a temporary rebound is in play, the broader sentiment remains weak unless a decisive breakout occurs.
Key Levels to Watch:
Resistance Levels: 91.85 (critical level), 92.84, 93.62
Support Levels: 87.87, 86.60, 85.70
Bearish Scenario:
A rejection from the 91.85 resistance level could reaffirm the downside bias, leading to a continuation of the bearish move toward 87.87, with extended declines targeting 86.60 and 85.70 over the longer timeframe.
Bullish Scenario:
A breakout above 91.85 with a daily close above this level would challenge the bearish sentiment, opening the door for further gains toward 92.84, followed by 93.60.
Conclusion:
The market sentiment remains bearish, with 91.85 acting as a critical resistance zone. A rejection from this level could reinforce the downtrend, while a confirmed breakout would shift the outlook to bullish, favouring further upside. Traders should closely monitor price action at this key level for confirmation.
This communication is for informational purposes only and should not be viewed as any form of recommendation as to a particular course of action or as investment advice. It is not intended as an offer or solicitation for the purchase or sale of any financial instrument or as an official confirmation of any transaction. Opinions, estimates and assumptions expressed herein are made as of the date of this communication and are subject to change without notice. This communication has been prepared based upon information, including market prices, data and other information, believed to be reliable; however, Trade Nation does not warrant its completeness or accuracy. All market prices and market data contained in or attached to this communication are indicative and subject to change without notice.

If you are trading JPY, keep an eye on the Tokyo CPIs tomorrowTomorrow, the 25th of April, we are getting the Tokyo CPI figures, which are expected to come out on the higher side. That said, we are looking at the core YoY number, which has a relatively high forecast.
Let's dig in.
FX_IDC:AUDJPY
FX_IDC:USDJPY
FX_IDC:EURJPY
FX_IDC:GBPJPY
Let us know what you think in the comments below.
Thank you.
77.3% of retail investor accounts lose money when trading CFDs with this provider. You should consider whether you understand how CFDs work and whether you can afford to take the high risk of losing your money. Past performance is not necessarily indicative of future results. The value of investments may fall as well as rise and the investor may not get back the amount initially invested. This content is not intended for nor applicable to residents of the UK. Cryptocurrency CFDs and spread bets are restricted in the UK for all retail clients.

Falling ChannelThe price has broken out followed by a horizonal correction, we now see a bullish impulse at hand
WE ONLY TRADE PULLBACKS
DM ME FOR VIP SIGNALS
AUD/JPY For Bullish as pull-backwait for pull-back near by entry point and then go long
general trend is down trend
current phase is pull-back
have fun :)

AUDJPY – Buy Limit Setup (Intraday)Published: 23/04/2025 10:09
Expires: 24/04/2025 06:00
Trade Summary
Type: Buy Limit
Entry: 90.25
Target: 92.25
Stop Loss: 89.25
Risk/Reward Ratio: 1:2
Duration: Intraday
📊 Technical View
Recent price action shows sideways congestion, indicating indecision.
RSI has turned positive, hinting at emerging bullish momentum.
A break above 91.00 would confirm a bullish breakout.
The measured move target sits at 92.50, aligning closely with our trade target.
A Buy Limit at 90.25 offers improved risk/reward versus chasing the market at current levels.
🔍 Key Technical Levels
Resistance: 91.00 / 92.00 / 92.50
Support: 90.50 / 90.25 / 89.50
📅 Next Volatile Events
No major economic events in the next 24 hours.
Disclosure: I am part of Trade Nation's Influencer program and receive a monthly fee for using their TradingView charts in my analysis.

SELL AUD/JPYAUD/JPY SELL NOW
ENTRY : 90.795
TP1 : 88.684
TP2 : 87.684
TP3 : 86.020
SL : 91.684
Do not risk more than 1% of your capital in a single trade!!!!!!!!!!!!!!!!!!!!!!!!!!!!!!!!!!!!!!!!!!!!!!!!!!!!!!!!!!!!!!!!!!!!!!!!!!!!!!!!!!!!!!!!!!!!!!!!!!!!!!!!!

AUD/JPY BEARS ARE GAINING STRENGTH|SHORT
AUD/JPY SIGNAL
Trade Direction: short
Entry Level: 90.909
Target Level: 88.668
Stop Loss: 92.394
RISK PROFILE
Risk level: medium
Suggested risk: 1%
Timeframe: 8h
Disclosure: I am part of Trade Nation's Influencer program and receive a monthly fee for using their TradingView charts in my analysis.
✅LIKE AND COMMENT MY IDEAS✅

AUD/JPY LongAUD/JPY Long
Minimum entry requirements:
• 1H impulse up above area of interest.
• If tight non-structured 1H continuation follows, 15 min risk entry within it if the continuation is structured on the 15 min chart.
• If tight structured 1H continuation follows, 1H risk entry within it.

AUDJPY - Bearish Triple TOPHello Traders !
The AUDJPY reached a strong resistance level !
The price formed a triple top pattern.
Currently, The neckline is broken !
So, I expect a bearish move📉
_________________
TARGET: 88.580🎯
