AUD/JPY For Bullishyou can go long now
or
wait for pull-back near entry point and then go long
general trend is up trend
have fun :)
AUDJPY trade ideas

NZDJPY FORERCASTTraders! We are starting again the new trading week! This week is looking good in terms of structure as the price seems like it has reached the potential zones! Today I have NZDJPY On my watch. This pair has reached the value area and we've seen a complete structure, What I only wait is the confirmational entry. Let's look at this with a close aye today!

AUDJPY Downtrend Intact — Eyes on the Next Leg Lower After RetraAUDJPY continues to bleed lower, and the trend shows no sign of slowing. This week’s market open and any gap will reveal whether we get a shallow or deeper retrace — either way, the setup points toward targeting the recent lows, and possibly breaking them.

AUD/JPY 4H chartKey Observations:
Support Zone (Gray Box at ~93.00 Level)
Price recently bounced off this minor support zone, indicating potential buying pressure.
Descending Trendline Resistance (Short-Term Bearish Structure)
Price is still respecting a descending trendline. A confirmed breakout above this trendline could signal further bullish movement.
Key Resistance to Watch: 94.22 - 94.50
The nearest resistance level is around 94.22, marked by previous structure and a potential breakout zone.
Larger Support Zone (~92.50 - Yellow Box)
If price fails to break the descending trendline and drops, the next strong buy area would be around 92.50, a stronger demand zone.
Buying Scenario (Bullish Confirmation)
✅ Entry: Wait for a breakout above the descending trendline and a retest of 93.60 - 93.70.
✅ Target: 94.22 - 94.50 (Short-Term) and 95.50 (Extended Target).
✅ Stop-Loss: Below 92.80 to allow room for volatility.
Risk to Consider (Bearish Rejection)
❌ If price fails to break the trendline, it may drop toward the 92.50 demand zone, offering a better buy entry.

AUDJPY PRINTING REVERSALTechnically:
AUDJPY is printing double bottom
AUDDJPY is printing bullish divergence

Will AUDJPY continue bearish trend? [Short Setup]Bearish rectangle is form on 1HR chart and there is no divergences. It's likely to continue bearish trend.
🔹When to Enter?
Enter in the trade when it retest it pervious day low which is 193.157. And target it to swing low, keep SL above pervious day low.
🔹 How to Take Trade?
- Only risk 1% of your portfolio
Like and subscribe to never miss a new idea! ✌🏼

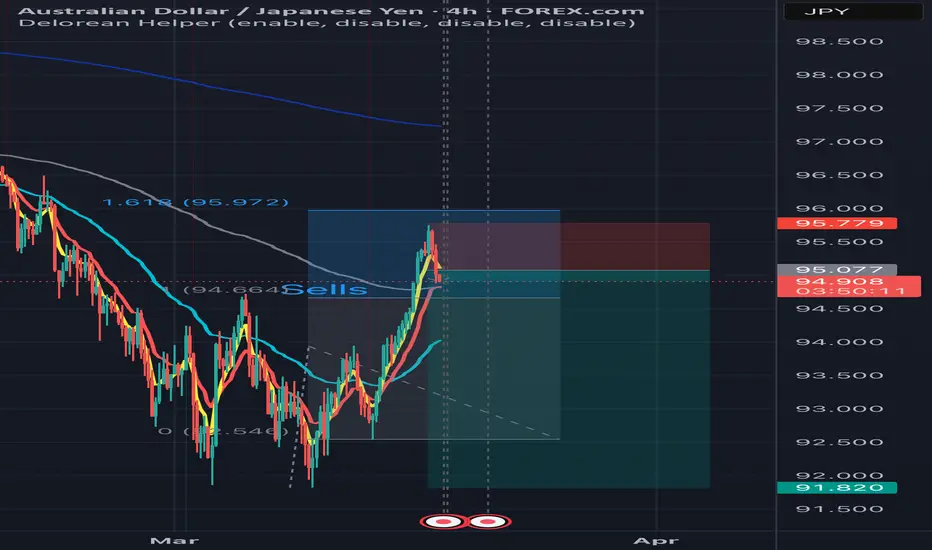
Short IdeaBearish, re-tracement leg in progress and waiting for price to reach zone before initiating sells - with confirmation - for possible lower prices.
Safe & happy trading.

AUDJPY is DecliningAt the starting our of US market, AUDJPY keeps lowering down.
Japan Jen is much more stable compared to the US Dollar, and also for Austral Dollar, and is having less whipsaws.

AUDJPY is BullishPrice is in an uptrend, and has printed a higher high, it has also retraced to 0.618 printing a potential higher low. According to Dow theory, it would now go on and print a higher high. Targets are mentioned on the chart.

AUDJPY Bearish continuation below 94.70Key Trading Level: 94.70
Bearish Scenario:
The overall sentiment remains bearish, aligned with the longer-term prevailing downtrend. Recent price action suggests a sideways consolidation, indicating potential continuation of the downtrend. A bearish rejection from 94.70 could reinforce selling pressure, targeting 92.33 as the first support level, with further downside extending toward 91.18 and 89.60 if bearish momentum strengthens.
Bullish Scenario:
A confirmed breakout above 94.70 and a daily close higher would invalidate the bearish outlook, signaling a potential shift in momentum. If buyers gain control, the next upside targets would be 95.56, followed by 96.60, where further resistance may emerge.
Conclusion:
The 94.70 level is a key pivot point in determining AUDJPY’s next directional move. A rejection at this level would reinforce the bearish outlook, while a breakout higher could indicate a potential trend reversal. Traders should monitor price action around 94.70 for confirmation of the next move.
This communication is for informational purposes only and should not be viewed as any form of recommendation as to a particular course of action or as investment advice. It is not intended as an offer or solicitation for the purchase or sale of any financial instrument or as an official confirmation of any transaction. Opinions, estimates and assumptions expressed herein are made as of the date of this communication and are subject to change without notice. This communication has been prepared based upon information, including market prices, data and other information, believed to be reliable; however, Trade Nation does not warrant its completeness or accuracy. All market prices and market data contained in or attached to this communication are indicative and subject to change without notice.

AUD/JPY For Bearish as Pull-Backyou can wait for pull-back near by entry point and then go short
general trend is up trend
current phase is pull-back
have fun :)

AUD JPY Moving in channel and reached the supportAUD JPY likely to move towards the 94.4. The inside channel shows a wedge pattern and will hit the higher low of main channel.


Gold Potential UpsidesHey Traders, in today's trading session we are monitorig AUDJPY for a selling opportunity around 94.600 zone, AUDJPY is trading in a downtrend and currently is in a correction phase in which it s approaching the trend at 94.600 support and resistance area.
Trade safe, Joe.

AUD_JPY RISKY LONG|
✅AUD_JPY made a retest
Of the horizontal support
Of 94.600 after a breakout
Earlier so we are bullish
Biased and we will be expecting
A further move up
LONG🚀
✅Like and subscribe to never miss a new idea!✅
Disclosure: I am part of Trade Nation's Influencer program and receive a monthly fee for using their TradingView charts in my analysis.

AUDJPY, 4H [COUNTER TREND TRADE]AUDJPY is on the bearish trend but I see a good BUY opportunity.
This is a counter trend trade = high risk trade

AUDJPY Triangular BreakoutWe're looking at a potential buy on AUDJPY with a Triangular Breakout. Expecting price to reach around 95.70 zone within next few hours


Bullish bounce off pullback support?AUD/JPY is falling towards the pivot and could bounce to the 1st resistance.
Pivot: 93.98
1st Support: 92.83
1st Resistance: 95.57
Risk Warning:
Trading Forex and CFDs carries a high level of risk to your capital and you should only trade with money you can afford to lose. Trading Forex and CFDs may not be suitable for all investors, so please ensure that you fully understand the risks involved and seek independent advice if necessary.
Disclaimer:
The above opinions given constitute general market commentary, and do not constitute the opinion or advice of IC Markets or any form of personal or investment advice.
Any opinions, news, research, analyses, prices, other information, or links to third-party sites contained on this website are provided on an "as-is" basis, are intended only to be informative, is not an advice nor a recommendation, nor research, or a record of our trading prices, or an offer of, or solicitation for a transaction in any financial instrument and thus should not be treated as such. The information provided does not involve any specific investment objectives, financial situation and needs of any specific person who may receive it. Please be aware, that past performance is not a reliable indicator of future performance and/or results. Past Performance or Forward-looking scenarios based upon the reasonable beliefs of the third-party provider are not a guarantee of future performance. Actual results may differ materially from those anticipated in forward-looking or past performance statements. IC Markets makes no representation or warranty and assumes no liability as to the accuracy or completeness of the information provided, nor any loss arising from any investment based on a recommendation, forecast or any information supplied by any third-party.

BUYGod First
Minimum Risk Maximum Reward
Action Backed Believe
# faith, strategy, and execution all in one #

AUD-JPY Bullish Continuation Expected! Buy!
Hello,Traders!
AUD-JPY is trading in a
Local uptrend and the pair
Made a bearish correction
And then retested the
Horizontal support of 94.595
And we are already seeing a
Bullish reaction from the
Support so as we are
Locally bullish biased
And we will be expecting
A further bullish move up
Buy!
Comment and subscribe to help us grow!
Check out other forecasts below too!
Disclosure: I am part of Trade Nation's Influencer program and receive a monthly fee for using their TradingView charts in my analysis.

AudjpyTrend fibonacci plus emas cross over in 1 hr timeframe. Pure technical analysis no news or stuff
AUDJPY Buy ForecastAUDJPY New Forecast👨💻👨💻
This is my personal trade and not in anyway a mandatory setup.
Note:
Follow proper risk management rules. Never risk more then 2% of your total capital. Money management is the key of success in this business...... Set your own SL & TP.
Please support this idea with a Like and COMMENT if you find it useful click "follow" on our profile if you will like these type of trading ideas delivered straight to your email in the future.
Thanks for your continued support!! lemme know your thoughts in the comment sec..
