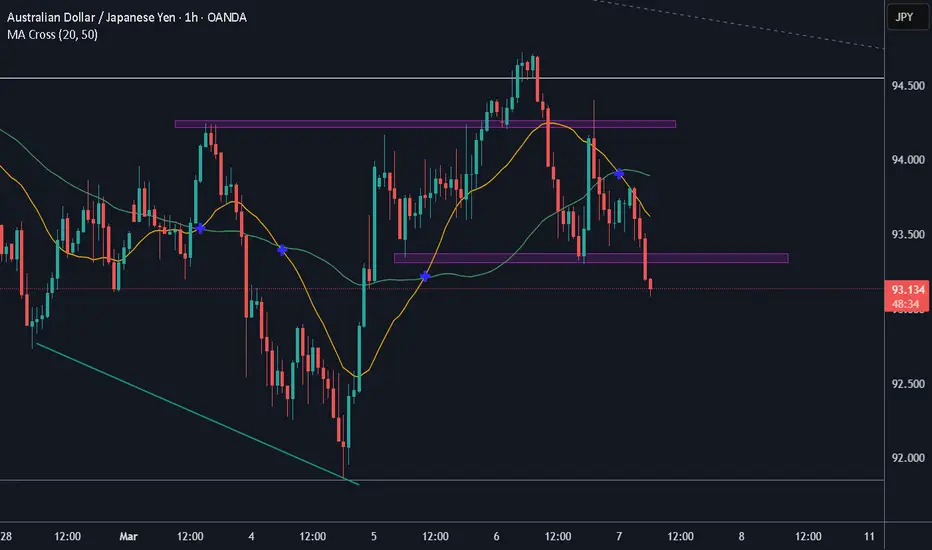
Trendline breakThe price broke a bearish trendline followed by a deep pullback, now the price looks to go long
WE ONLY TRADE PULLBACKS
AUDJPY trade ideas

AUDJPY The Target Is UP! BUY!
My dear friends,
My technical analysis for AUDJPY is below:
The market is trading on 92.761 pivot level.
Bias - Bullish
Technical Indicators: Both Super Trend & Pivot HL indicate a highly probable Bullish continuation.
Target - 93.288
About Used Indicators:
A pivot point is a technical analysis indicator, or calculations, used to determine the overall trend of the market over different time frames.
———————————
WISH YOU ALL LUCK

Almost Perfect Trade opportunity on an Fx-Minor This Week.AUD is usually considered sensitive to Global risk sentiment.
The narrowing yeild between the interest rates between AUSTRALIAN and JAPAN Govs
"can"* shift towards risk aversion
all of which can ed up favoring JPY which is more stable as a currency.
and so i marked this super 1:8 Trade Using my 2025 ADR projections.

AUDJPY SHORT, S/D 1H X OTElooking at the chart there is an untapped supply zone which also falls exactly on the FIB OTE AND might act as a continuation trigger for the price downside, target will also be the previous week low. so lets see if this will play out.
NOTE: no limit order, what we do is watch how the candle react on getting to the zone, look for a pin bar rejection candle ( CRT) and enter on the next candle or wait for a bearish engulfing all on the 1H time frame.

AUDJPY Long Swing PositionEntry: 93.988
Stop Loss: 91.692
Take Profit 1: 95.999
Take Profit 2: 97.658
Take Profit 3: 99.600

AUD/JPY BEARS ARE GAINING STRENGTH|SHORT
Hello, Friends!
AUD/JPY pair is trading in a local downtrend which know by looking at the previous 1W candle which is red. On the 1H timeframe the pair is going up. The pair is overbought because the price is close to the upper band of the BB indicator. So we are looking to sell the pair with the upper BB line acting as resistance. The next target is 92.334 area.
✅LIKE AND COMMENT MY IDEAS✅


In this video i will show fractalsin this video i wil show my friends how i am looking for a cfractal break. I dont get it how to do it/.

AUDJPY SHORT 8K PROFIT LIVE TRADE UPDATE The Australian dollar is a cyclical currency which is sensitive to the global economic cycle. When the economy is doing well (economic expansion), companies increase demand for raw materials (think Chinese companies, one of Australia’s major trading partners). And given that Australia is a commodity-linked currency, known for its exports in metals and minerals—such as iron ore, copper, gold and lithium—the increased demand for commodities and inflows into AUD often underpins the currency, and vice versa for an economy doing poorly (economic contraction).
The Japanese yen, on the other hand, is a safe-haven currency; in times of economic uncertainty, funds tend to flow into the JPY during risk-off markets, making it more of a defensive play, if you will.
As a result, the AUD/JPY currency pair is sensitive to changes in global commodity prices, and will often rise when the global economy is doing well and fall when the economy is contracting (as traders and investors bid the JPY). This is why some refer to this currency pair as a risk barometer. In other words, it tends to rise when investors are feeling more confident about the global economy and fall when investors are feeling more risk-averse.
It should also not surprise you to note that there is a strong positive correlation between the AUD/JPY and the S&P 500. As you can see, based on a 60-day rolling correlation coefficient, the two markets correlate most of the time.

Pullback tradeIn my previous trade last week, i predicted a bearish move, now the price looks to continue its bearish run after it made a pullback
WE ONLY TRADE PULLBACKS

AUDJPY LIVE TRADE UPDATE 6K PROFITSFactors Contributing to AUD Weakness:
Commodity Price Fluctuations:
The Australian Dollar is closely tied to commodity prices, particularly those of raw materials like iron ore and coal. Any decline in these prices can put downward pressure on the AUD.
Reserve Bank of Australia (RBA) Policy:
RBA policy decisions, including interest rate adjustments and forward guidance, significantly impact the AUD. If the RBA adopts a dovish stance (indicating potential rate cuts or a slower pace of tightening), it can weaken the AUD.
Australian Economic Data:
Economic indicators such as GDP growth, employment figures, and inflation data play a crucial role. Weaker-than-expected data can lead to a decline in the AUD.
Global Risk Sentiment:
The AUD is often considered a risk-on currency. During periods of global economic uncertainty or risk aversion, investors tend to move away from the AUD, weakening it.

Trade outlook 3-10-25In this video i will show my friends what i am gonna trade for the week. I will have a look for eu shorts and jpy pairs longs.

AUD/JPY LongStart of the week, AUDJPY has found support on the Daily timeframe and 4 hour. Bullish pattern present on lower timeframe with the inverse head and shoulders. Bull traders are mounting the pressure with several bearish candles rejections to the sell side.

**AUD/JPY Short Trade Recap – 30-Day Swing Trade** **AUD/JPY Short Trade Recap – 30-Day Swing Trade**
I recently exited a **30-day swing short trade** on AUD/JPY, capturing a well-structured move based on multiple confluences.
### **Technical Reasons for the Trade:**
- 📉 **Trend:** Clear **downtrend** alignment.
- 🔴 **Oscillators:** **Overbought** conditions signaled exhaustion.
- 📊 **Price Action:** Strong **sell signal** at a key **supply zone**.
- 🔄 **Mean Reversion:** Price **retraced to the mean** after completing a **5-wave structure** on the 4H timeframe.
### **Fundamental Reasons for the Trade:**
- 📉 **COT Data:**
- **Bearish AUD:** Commercials were aggressively shorting AUD.
- **Bullish JPY:** Commercials increased their long positions on JPY.
- 💰 **Monetary Policy Divergence:**
- **RBA Rate Cuts:** The **Reserve Bank of Australia (RBA)** cut rates to **4.10%** on **February 18, 2025**, citing **slowing inflation**.
- **Japan’s Strength:** Japan’s economy showed **2.8% annualized GDP growth** in **Q4 2024**, strengthening the Yen.
- 🛑 **Market Sentiment:**
- **Risk-Off Environment:** A shift in sentiment favored the safe-haven JPY over the risk-sensitive AUD.
- **Bond Yields:** Rising **Japanese Government Bond (JGB) yields** further supported JPY strength.
### **Trade Outcome:**
This trade played out exactly as planned, reaching its target as AUD/JPY moved lower. A textbook **combination of technical structure, COT positioning, and macro fundamentals**.
✅ **Executed the plan, managed risk, and booked profits. On to the next trade!** 🚀


AUDJPY 1WThe price is moving within an ascending channel and is also in a strong support zone, suggesting that a big move is likely to happen soon.👌

AUDJPY - Growing SHORTS! Big Move Ahead!In one of our last AUDJPY analysis, we indicated that price looked foppish. Since then, we've had almost a 2000pip drop!
That big drop can be marked as wave 1 in our new bearish impulsive trend.
We are now in Wave 2, which is an ABC correction. We have completed Wave A (3 waves). We are now in Wave B (3 waves). We're currently in subwave b of wave B. Expecting subwave c to appear very soon.
Trade Idea:
- Watch for bearish price action on lower timeframe
- You can use trendline break, fibs or BOS to find the reversal point
- When entered, put stops above subwave B.
- Target: 91 (750pips)
4Week Chart
Goodluck and as always, trade safe!
See our previous setups below:

AUDJPY The Week Ahead 10th March ‘25. Key Trading Level: 94.70
Bearish Scenario:
The overall sentiment remains bearish, aligned with the longer-term prevailing downtrend. Recent price action suggests a sideways consolidation, indicating potential continuation of the downtrend. A bearish rejection from 94.70 could reinforce selling pressure, targeting 92.33 as the first support level, with further downside extending toward 91.18 and 89.60 if bearish momentum strengthens.
Bullish Scenario:
A confirmed breakout above 94.70 and a daily close higher would invalidate the bearish outlook, signaling a potential shift in momentum. If buyers gain control, the next upside targets would be 95.56, followed by 96.60, where further resistance may emerge.
Conclusion:
The 94.70 level is a key pivot point in determining AUDJPY’s next directional move. A rejection at this level would reinforce the bearish outlook, while a breakout higher could indicate a potential trend reversal. Traders should monitor price action around 94.70 for confirmation of the next move.
This communication is for informational purposes only and should not be viewed as any form of recommendation as to a particular course of action or as investment advice. It is not intended as an offer or solicitation for the purchase or sale of any financial instrument or as an official confirmation of any transaction. Opinions, estimates and assumptions expressed herein are made as of the date of this communication and are subject to change without notice. This communication has been prepared based upon information, including market prices, data and other information, believed to be reliable; however, Trade Nation does not warrant its completeness or accuracy. All market prices and market data contained in or attached to this communication are indicative and subject to change without notice.

Head and shoulders patternThe price has formed a pattern followed by an attempted breakout then pullback and now a breakout, time to go short
WE ONLY TRADE PULLBACKS
AUDJPY BEARISHMy various forms of analysis, which always include a quantitative outlook, indicate that the bearish momentum should continue up to the marked price. This outlook is for the long term.


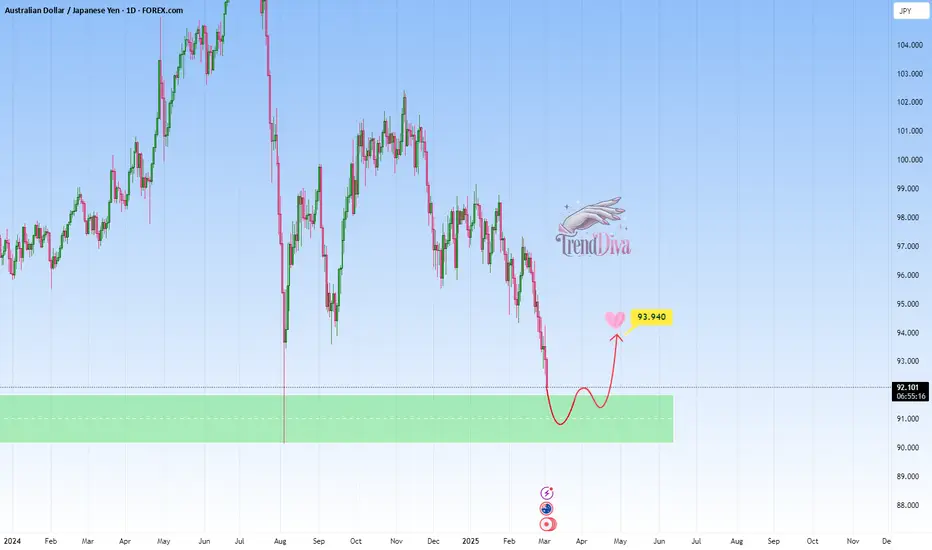
AUDJPY Approaching Key Support - Will Price Rebound to 93.940?OANDA:AUDJPY is approaching a key support level, an area where buyers have previously shown strong interest. The recent bearish movement suggests that price may soon be testing this level, potentially setting up for a rebound.
A bullish confirmation, such as a strong rejection pattern, bullish engulfing candles, or long lower wicks, would strengthen the case for a move higher. If buyers step in, the price could rally toward 93.940, aligning with the next key resistance level.
However, a decisive breakdown below this support would invalidate the bullish scenario and could lead to further downside.
This is not financial advice but rather how I approach support/resistance zones. Remember, always wait for confirmation, like a rejection candle or volume spike before jumping in.
Best of luck, TrendDiva.
AUDJPY - potential SHORT trade with 2 potential targetsHigher timeframe trend = down
Retail traders = long
JPY = Strong, AUD = Weak
Therefore bias = down
NOTE : Not in yet - Entry order set below the structure that is forming currently.
A decent level of structure was broken to the left (marked with red horizontal ray) so I believe more downside is incoming (potentially all the way to the white horizontal ray which marks lows created back in August 24)
Target is a distance above to low that was created in August 24 (marked with white dotted horizontal ray) - these lows might be a decent 2nd target for anyone who trades extended targets. I personally do not.
Stops where my personal backtesting has suggested they be placed to invalidate the trade. If price gets to stops before triggering in, entry order is cancelled.
Please keep in mind that there is another layer of analysis that goes into this that is part of my personal plan.
