AUDJPY Technical & Order Flow AnalysisOur analysis is based on a multi-timeframe top-down approach and fundamental analysis.
Based on our assessment, the price is expected to return to the monthly level.
DISCLAIMER: This analysis may change at any time without notice and is solely intended to assist traders in making independent investment decisions. Please note that this is a prediction, and I have no obligation to act on it, nor should you.
Please support our analysis with a boost or comment!
AUDJPY trade ideas
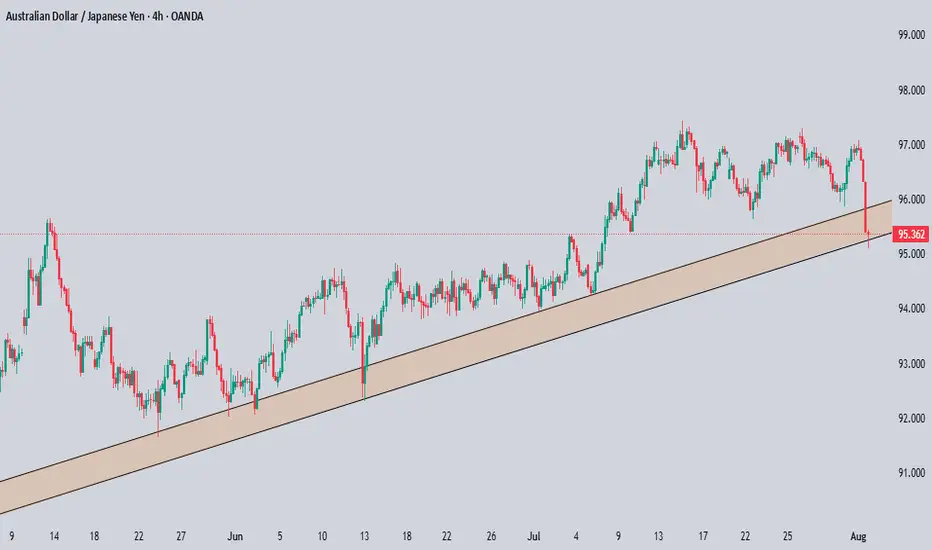

AUD-JPY Bearish Breakout! Sell!
Hello,Traders!
AUD-JPY made a bearish
Breakout of the rising support
Line and we are bearish biased
So we will be expecting a
Further bearish move down
Sell!
Comment and subscribe to help us grow!
Check out other forecasts below too!
Disclosure: I am part of Trade Nation's Influencer program and receive a monthly fee for using their TradingView charts in my analysis.

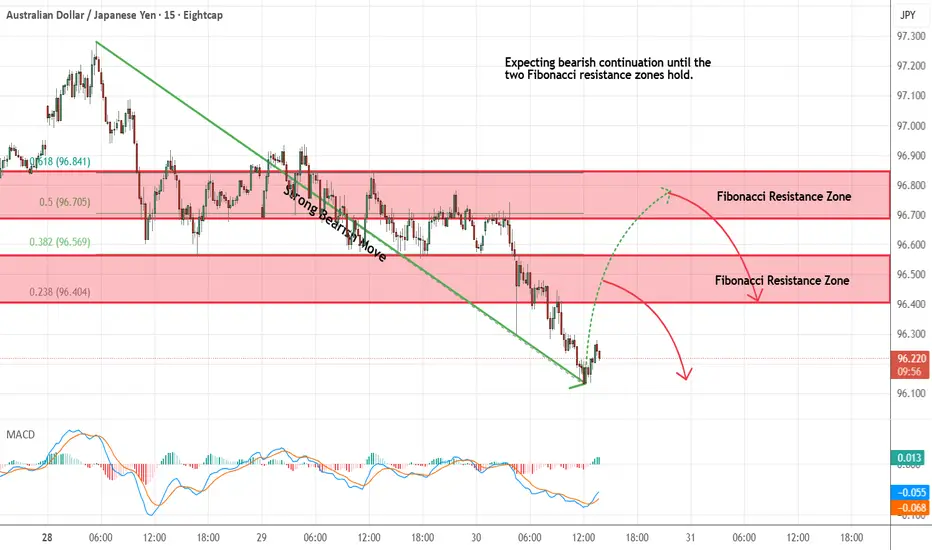
AUDJPY - Looking To Sell Pullbacks In The Short TermM15 - Strong bearish move.
No opposite signs.
Currently it looks like a pullback is happening.
Expecting bearish continuation until the two Fibonacci resistance zones hold.
If you enjoy this idea, don’t forget to LIKE 👍, FOLLOW ✅, SHARE 🙌, and COMMENT ✍! Drop your thoughts and charts below to keep the discussion going. Your support helps keep this content free and reach more people! 🚀
--------------------------------------------------------------------------------------------------------------------
AUDJPY 24.07.2025+~ RBA is relatively hawkish
+~ Political uncertainty around JPY
+~ Positive trade deals anticipation
*Swing trade; giving a room for a reasonable pullback; will potentially look to scale in at the resolve of a newly-formed structure.
AUD/JPY Poised for Breakout After Liquidity Trap? 🔍 Key Observations:
🔻 Trendline resistance holding strong, forming lower highs.
📉 Sell-side liquidity resting just below horizontal support (marked zone).
💧 Price dipped into liquidity grab zone twice — sign of stop hunt.
🔁 Classic accumulation schematic forming — repeated sweeps before potential breakout.
📊 Volume divergence: Selling pressure weakening while liquidity is swept.
📉 RSI shows bullish divergence (price making lower lows, RSI making higher lows).
🔁 Rejection at RSI 40-level could indicate a bounce.
📈 Expectation:
One more fake breakdown below 96.500 could trigger aggressive buying — setting up a potential parabolic move toward 97.200+ if breakout occurs.

AUDJPY TRADE IDEA UPDATE AUDJPY also made a pullback to our Fibonacci level and has made a move to the upside.
AUDJPY Long TradeOANDA:AUDJPY Long Trade.
Entry price is already tapped in, I checked chart late, TP is intact, you can take little risk if you can afford.
Note: Manage your risk yourself, its risky trade, see how much your can risk yourself on this trade.
Don't be greedy.
Use proper risk management
Looks like good trade.
Lets monitor.
Use proper risk management.
Disclaimer: only idea, not advice

AUDJPY Retest H4 resistance The AUD/JPY currency pair appears poised to potentially extend its current bearish trajectory, particularly as the price action has recently reacted to an unmitigated order block situated around the 97.00 level. This specific price zone could act as a significant area of supply, triggering renewed selling pressure that may drive the pair lower. Should bearish momentum persist, it’s plausible that the price could descend toward the 96.00 region as an initial target. Furthermore, if sellers maintain control and market sentiment remains risk-averse, the downward movement could intensify, possibly resulting in a break below the key support area near 95.500—effectively sweeping liquidity beneath that level and opening the door for even deeper retracements.

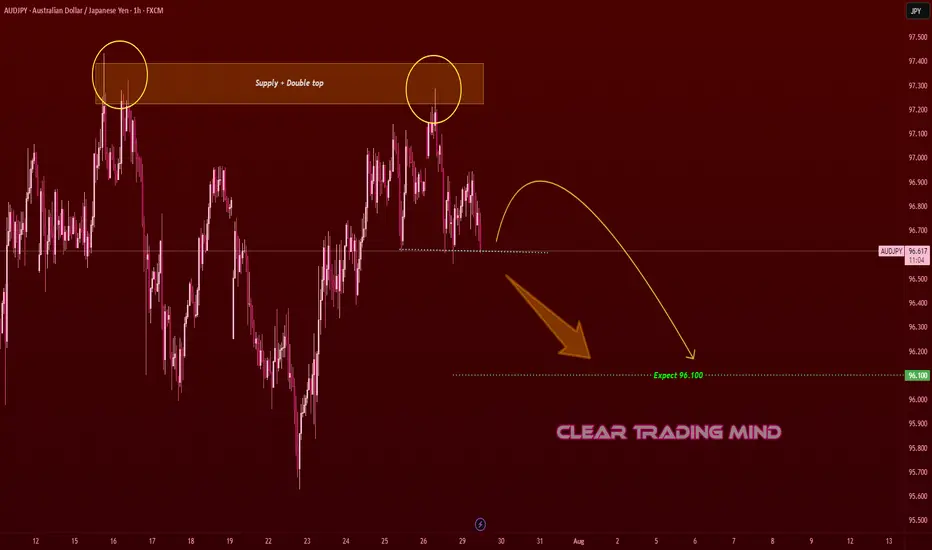
AUDJPY Double Top at Supply Zone – Bearish Move to 96.10?AUDJPY – Bearish Bias
- Pattern: Double Top + Supply Zone Rejection
- Current Price: Around 96.65
- Expected Target: 96.10
- The chart shows a double top pattern near the supply zone, signaling potential weakness.
- Price failed to break above the supply area twice, creating bearish sentiment.
- A pullback towards resistance followed by rejection could trigger a move down to 96.10.
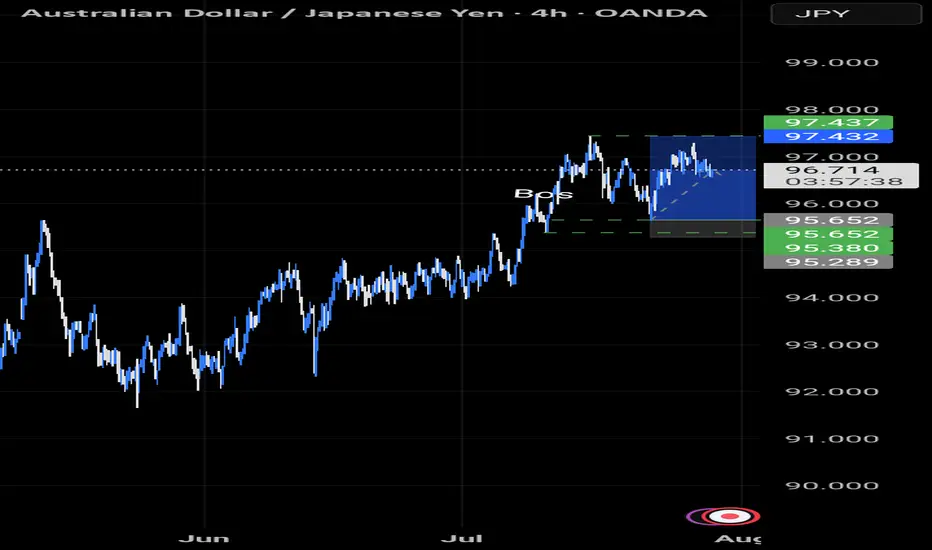
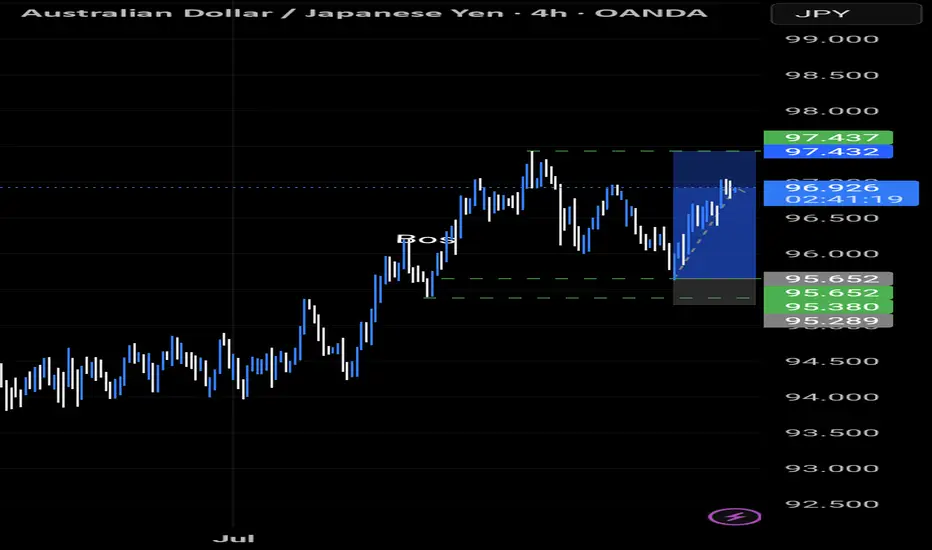
AUDJPY RETEST SUPPORT AUDJPY sweeps liquidity and retests support hopefully it continues the uptrend towards 97.430

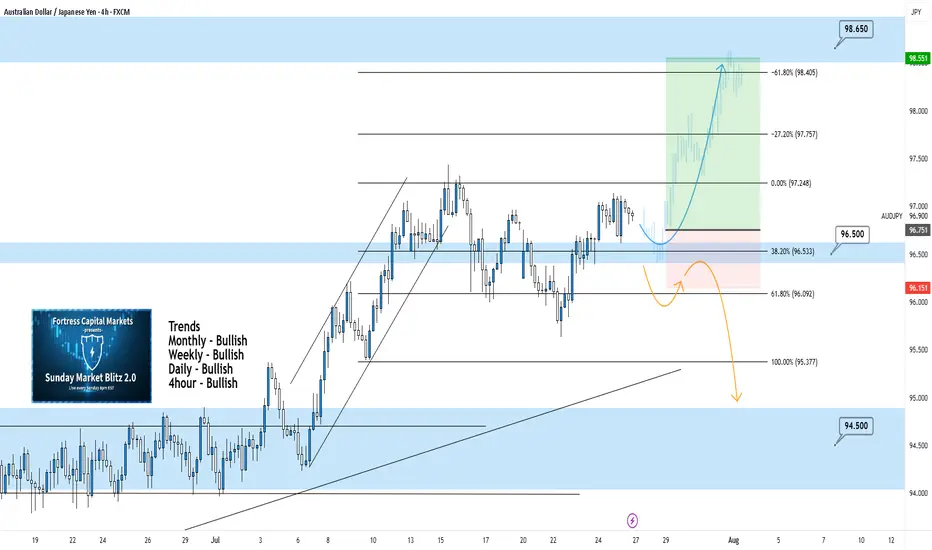
AUDJPY 4Hour TF - July 27th, 2025AUDJPY 7/27/2025
AUDJPY 4hour Bullish Idea
Monthly - Bullish
Weekly - Bullish
Dailly - Bullish
4hour - Bullish
We’re looking bullish again on AUDJPY for the week ahead, but will it stick? The overall higher timeframes suggest we are bullish as well but we will need to see key structure before entering any trades. Let’s take a look at two potential scenarios we would want to see happen this week.
Bullish Continuation - We ended last week in a perfect spot, right above our 96.500 zone. This leaves us in a position for a potential long opportunity where we only need to see 1 or two more forms of confirmation.
Look for our 96.500 zone to be tested and held as support. If this happens and we can confirm a higher low above 96.500 we’ll be looking to enter and target higher toward major levels of resistance like 98.650.
Bearish Reversal - For us to consider AJ bearish again we would need to see a strong break below the current zone at 96.500.
Look for signs of structure (LL, LH) to form below the current zone. If this happens we can consider targeting lower toward major levels of support like 94.500
AUD/JPY SENDS CLEAR BEARISH SIGNALS|SHORT
Hello, Friends!
AUD/JPY pair is in the uptrend because previous week’s candle is green, while the price is clearly rising on the 4H timeframe. And after the retest of the resistance line above I believe we will see a move down towards the target below at 96.380 because the pair overbought due to its proximity to the upper BB band and a bearish correction is likely.
Disclosure: I am part of Trade Nation's Influencer program and receive a monthly fee for using their TradingView charts in my analysis.
✅LIKE AND COMMENT MY IDEAS✅

AUDJPY Possible Short set-upPrice is currently forming a possible Distribution Schematic 2 Wyckoff. Also, price may currently form the Phase C of the schematic.

AUDJPY: Strong Bearish Signal?! 🇦🇺🇯🇵
AUDJPY may retrace from a key daily resistance.
As a confirmation, I see a bearish breakout of a support line of a rising
wedge pattern with a high momentum bearish candle.
Goal - 96.47
❤️Please, support my work with like, thank you!❤️
I am part of Trade Nation's Influencer program and receive a monthly fee for using their TradingView charts in my analysis.

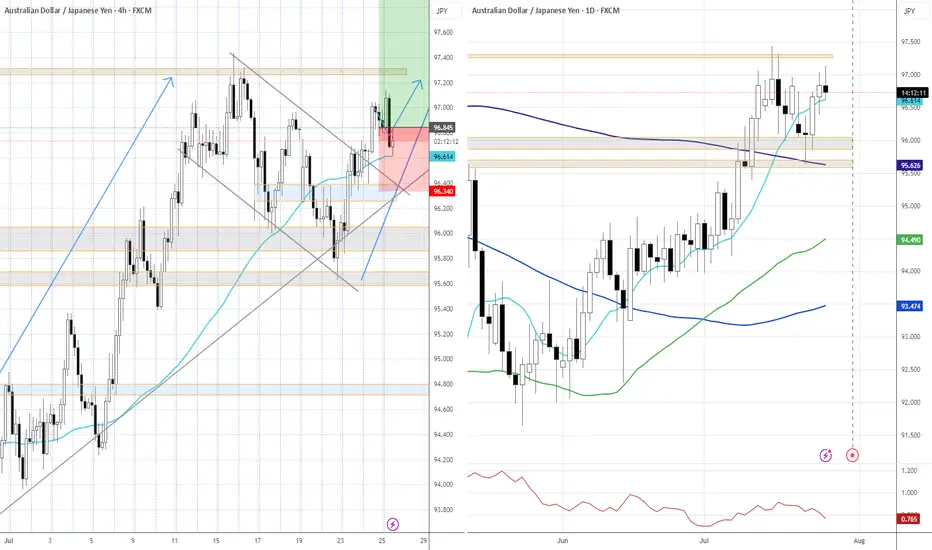
AUDJPY: Bullish Structure Shift Signals Institutional Buy ZoneGreetings Traders,
In today’s analysis of AUDJPY, we observe a recent bullish market structure shift (MSS), signaling potential for continued upward movement. With this in mind, we aim to capitalize on buying opportunities at key institutional points of interest to target higher premium prices.
Higher Timeframe Context:
The weekly timeframe maintains a clear bullish narrative. This long-term bias is now supported by a bullish MSS on the H4 timeframe, offering strong confluence and alignment across both macro and intermediate structures. This increases our confidence in expecting further bullish continuation.
Key Observations on H4:
Weekly Fair Value Gap (FVG) Support: Price recently pulled back into a weekly FVG and has rebalanced that inefficiency. This reaction aligns with the H4 MSS, reinforcing the weekly FVG as a strong institutional support zone.
Reclaimed Bullish Order Block: After the MSS, price retraced into a bullish reclaimed order block—an area where previous institutional positioning occurred. Since price has now reclaimed this level, it becomes a high-probability zone for renewed buying interest in the direction of the dominant trend.
Lower Timeframe Confirmation: This reclaimed order block will serve as our primary zone of interest to seek confirmations on the lower timeframes for precise entries.
Trading Plan:
Entry Strategy: Wait for bullish confirmation within the reclaimed H4 order block zone before entering long positions.
Target: The primary objective is the H4 liquidity pool situated at premium prices, which the market is likely to be drawn toward.
For a detailed market walkthrough and in-depth execution zones, be sure to watch this week’s Forex Market Breakdown:
As always, execute with discipline and align your trade management with your overall plan.
Kind Regards,
The Architect 🏛️📈

Falling ChannelThe price broke out of a falling channel pattern followed by a pullback, now the price looks to go long after making a higher high
WE ONLY TRADE PULLBACKS

AUDJPY TRADE IDEA AUDJPY traded down to our Fibonacci level and has done it's thing to the upside....
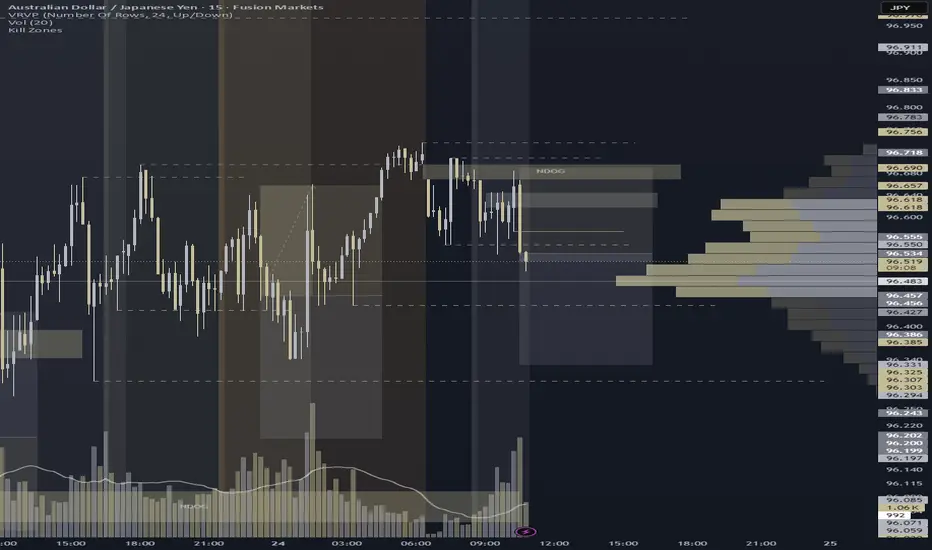
AUDJPY – NDOG & Resistance Zone Campaign
Shorted after clean reaction from NDOG (96.669–96.697) and rejection at my 96.617–96.645 resistance zone. Entered on a strong bearish shift candle with solid volume. TP locked at 96.331, past the 96.439 sellside draw, aiming toward structural liquidity near 96.301. Playbook reminder: structure validated, entry timing needs refinement—early trigger noted. SL hit after engineered volatility, but bias read and magnet zone logic held firm.
AUDJPY BullishAfter exiting a correction, the first impulse (Wave 1) appears. I expect a retracement of at least 50% of the Fibonacci.

CONFLUENCE will increase the PROBABILITY of your TRADEif you find enough confluence/reasons to take a trade and there isn't too much opposing data then you have a high probability trade. BUT you MUST know what you're looking for in order to build confluence. This vid will help you

AUDJPY Q3 | D24 | W30 | Y25📊AUDJPY Q3 | D24 | W30 | Y25
Daily Forecast🔍📅
Here’s a short diagnosis of the current chart setup 🧠📈
Higher time frame order blocks have been identified — these are our patient points of interest 🎯🧭.
It’s crucial to wait for a confirmed break of structure 🧱✅ before forming a directional bias.
This keeps us disciplined and aligned with what price action is truly telling us.
📈 Risk Management Protocols
🔑 Core principles:
Max 1% risk per trade
Only execute at pre-identified levels
Use alerts, not emotion
Stick to your RR plan — minimum 1:2
🧠 You’re not paid for how many trades you take, you’re paid for how well you manage risk.
🧠 Weekly FRGNT Insight
"Trade what the market gives, not what your ego wants."
Stay mechanical. Stay focused. Let the probabilities work.
FRGNT

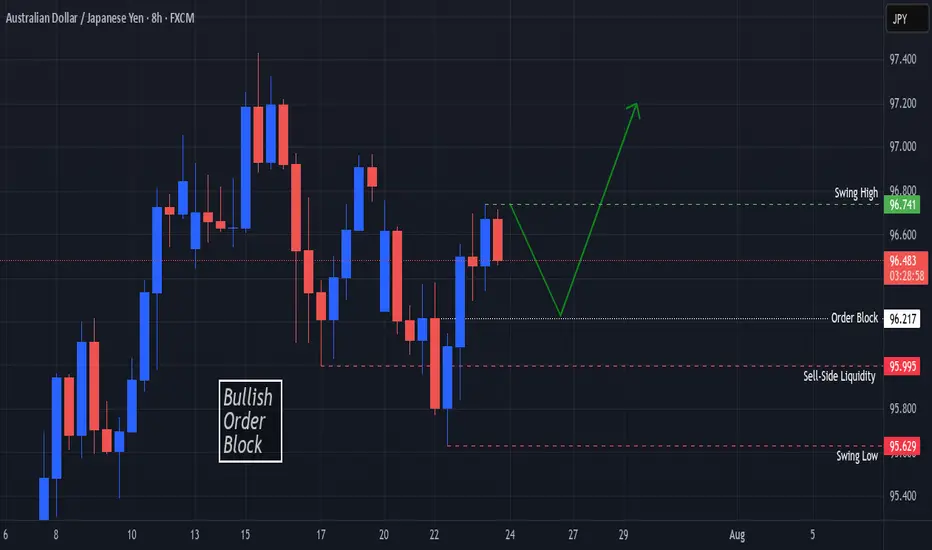
AUDJPY Bullish Order Block In SightOANDA:AUDJPY Price finds Support at the Swing Low @ 95.629 and creates a Swing High @ 96.741!
Based on the ICT Method, the Swing Low broke Sell-Side Liquidity @ 95.995 and opened up a Bullish Order Block Opportunity @ 96.217!
Price is currently working down from 96.49 at the time of publishing but once Price visits the Order Block, this could deliver Long Opportunities!!