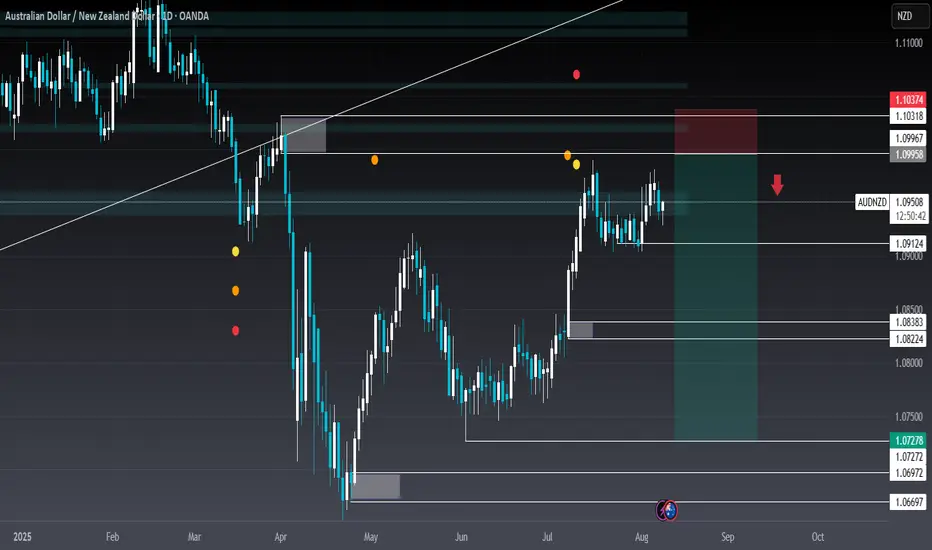
Sell level audnzdOur last buying idea already running 300 pips in buy
Now we are looking for a short term bearish correction
Market gonna overbought on daily time frame and let close this week candel
After confirming sell audnzd
AUDNZD trade ideas


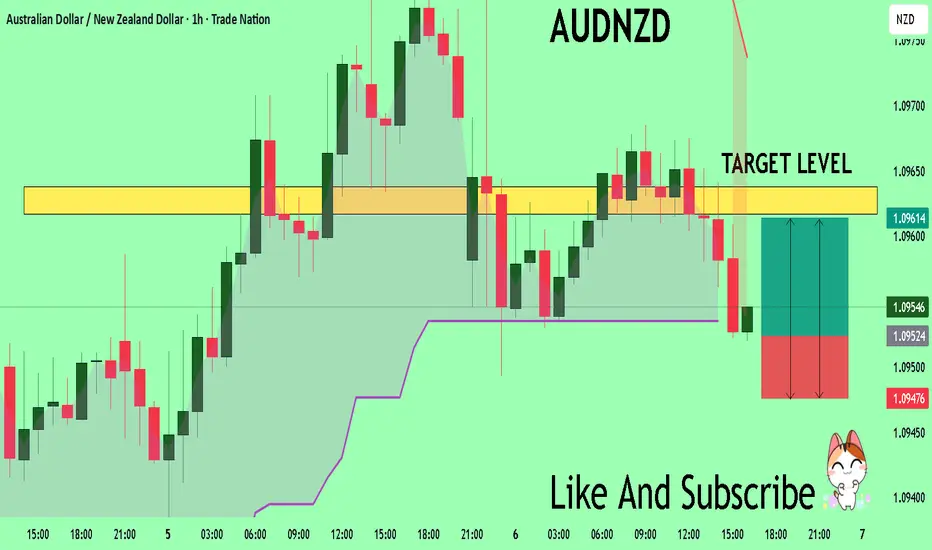
AUDNZD: Expecting Bearish Continuation! Here is Why:
Looking at the chart of AUDNZD right now we are seeing some interesting price action on the lower timeframes. Thus a local move down seems to be quite likely.
Disclosure: I am part of Trade Nation's Influencer program and receive a monthly fee for using their TradingView charts in my analysis.
❤️ Please, support our work with like & comment! ❤️

AUDNZD Technical + Fundamental Align for DownsideToday I want to analyze a short position on the AUDNZD ( OANDA:AUDNZD ) pair, first, let's look at it from a fundamental analysis perspective .
Fundamental View on AUDNZD
Key reasons to short AUDNZD:
Australian weakness:
Recent data show weakening consumer sentiment and declining building approvals. The RBA seems hesitant to hike further, putting pressure on the Aussie.
New Zealand resilience:
The RBNZ maintains a relatively hawkish stance. Inflation is still a concern, and the central bank is committed to keeping rates high, supporting NZD strength.
Monetary policy divergence:
The divergence between RBA’s dovish stance and RBNZ’s hawkish approach supports further downside in AUDNZD.
----------------------
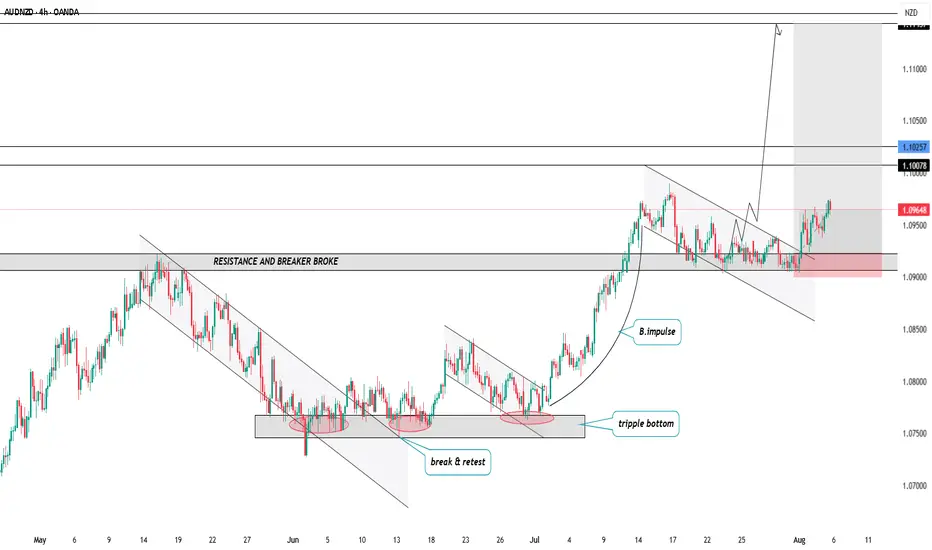
Now let's take a look at AUDNZD from a technical analysis perspective on the 4-hour timeframe .
AUDNZD is currently trading in a Heavy Resistance zone(1.0963 NZD-1.0870 NZD) near the upper line of the Range Channel , Potential Reversal Zone(PRZ) and Yearly Pivot Point .
In terms of Elliott Wave theory , AUDNZD appears to be completing microwave B of microwave Y of the main wave 4 .
I expect AUDNZD to drop to at least 1.0904 NZD(First Target) based on the above explanation .
Second Target: 1.0886 NZD
Note: Stop Loss(SL): 1.0963 NZD
Please respect each other's ideas and express them politely if you agree or disagree.
Australian Dollar/New Zealand Dollar Analyze (AUDNZD), 4-hour time frame.
Be sure to follow the updated ideas.
Do not forget to put a Stop loss for your positions (For every position you want to open).
Please follow your strategy and updates; this is just my Idea, and I will gladly see your ideas in this post.
Please do not forget the ✅' like '✅ button 🙏😊 & Share it with your friends; thanks, and Trade safe.

AUDNZD SELL setup formingAUDNZD SELL setup forming
Two Sell order opportunity, Will update for accurate Target Profit value once Sell order executed

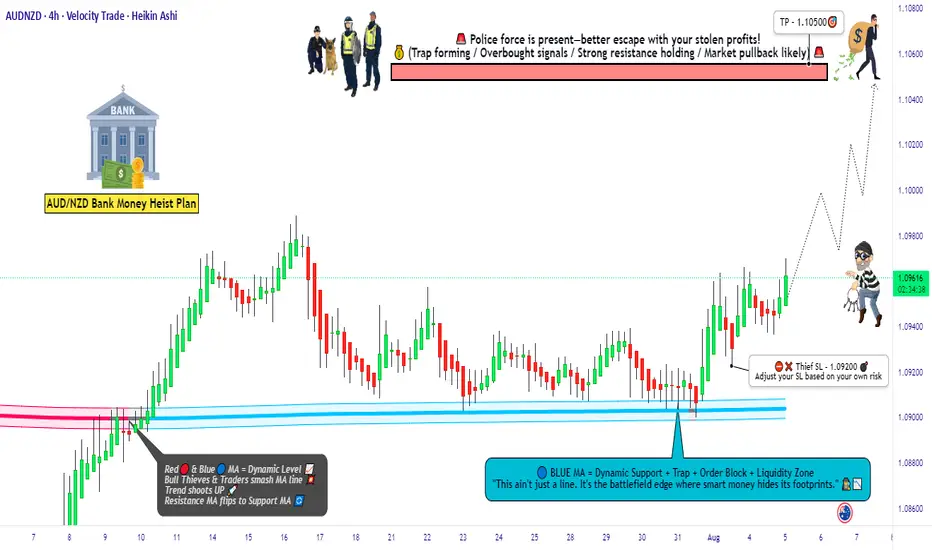
AUD/NZD Heist Loading... Will the Kiwi Surrender to the Aussie?🦘💵 AUD/NZD BULLISH LOOT RAID – THIEF TRADER ENTRY ACTIVE! 🔓🧠
🧭 Asset: AUD/NZD
📊 Plan: Bullish Heist in Progress
🎯 Entry: Thief dives in at any price – using layered limit orders to trap the perfect fill.
🛑 Stop Loss: 1.09200 – Emergency exit if alarms go off 🚨
💰 Target: 1.10500 – Vault full of pips awaiting collection! 💼💸
🕵️♂️ THIEF STRATEGY SNAPSHOT:
The Aussie is loading up the bags and the Kiwi’s guard is down 🐨🆚🥝.
This isn't just a trade—it’s a covert FX raid. Thief is stalking price silently, placing sneaky limit orders in layers—waiting for the market to slip up.
🚪 No fixed door in—every pullback is a crack in the vault.
⚔️ Patience is the blade—entries are stealthy, exits are explosive.
🧠 Using both market structure + sentiment, we sniff out the liquidity stash!
💡 TRADE TIPS FROM THE THIEF'S VAULT:
📉 Layer entries across minor dips (M15-H1 zones) – never chase.
🏃♂️ Price nearing reversal zones? Use tight stops and trail profits like a pro.
📰 Avoid entries during red news – get in before the crowd, not with them.
🧭 This pair respects structure. Don't fight momentum—ride it like a bandit horse.
🔔 THIEF CODE: “We don’t predict—we prepare.”
🎯 Lock in, layer deep, loot fast.
💬 Drop your setup thoughts below 💣
❤️ Like this? Smash that 👍 and join the thief crew!
📌 Save this plan & follow for more stealth market raids.
🕶️ Stay sharp. Stay hidden. Stay profitable.
💼 Next vault breach loading... 👇
📍#ThiefTrader #AUDNZD #LayeredLootPlan #ForexHeist #MarketRaiders
AUDNZDAUDNZD since when i shared last time has managed to move with up to 50 pips , still thee is a very strong bulishing continuation , take time to refine an entry .... and catch this movement
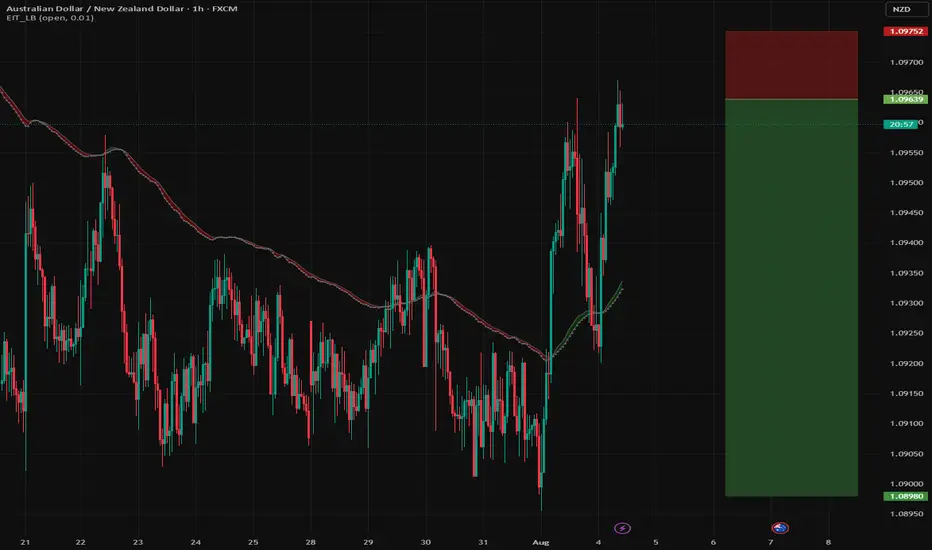
AUDNZD: Waiting for the Kangaroo to SlipThe trend is up — but I’m not buying the bounce. AUDNZD is pushing into resistance, and while the bulls still have short-term control, I’m watching closely for a sell signal. I want to short this pair — but not until the chart tells me the rally is running out of steam.
📉 Trade Bias: I’m looking to short AUDNZD at resistance — once price action confirms weakness.
Here’s why I’m eyeing this setup:
🇦🇺 AUD strength is driven by global optimism, not domestic momentum
🇳🇿 NZ business confidence is booming — 11-year high
🔄 Both central banks are cautious, but the RBA is closer to cutting
🔮 RBA’s next move (August 12) could trigger AUD downside
📊 COT data shows flat AUD bets and a tilt toward NZD shorts reversing
AUD’s recent rally has little to do with fundamentals. It’s been lifted by risk-on flows tied to global trade headlines — but under the hood, things don’t look so hot. Inflation is softening, and the RBA is likely to cut rates soon. Meanwhile, domestic spending and investment remain weak.
NZD isn’t flying, but it’s holding firm. Confidence is building slowly, and although more rate cuts may come later, the RBNZ is taking its time. Traders seem to be shifting away from NZD shorts, showing a slow turn in sentiment.
If AUDNZD stalls here, this could be a fading opportunity. But I won’t jump in without confirmation.
Patience first, then action. Are you watching this zone too — or still riding the bull? 👇
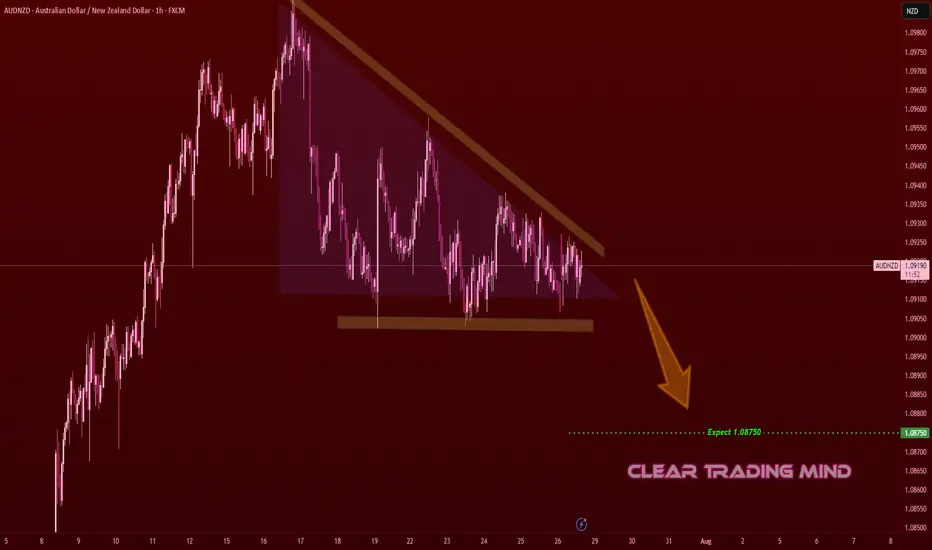
AUDNZD Descending Triangle – Bearish Breakout SetupOn the 1-hour chart, AUDNZD is forming a descending triangle 📐, a bearish continuation pattern.
- Horizontal support is holding but getting repeatedly tested
- Lower highs indicate selling pressure
Plan:
- Break and close below support may trigger a bearish continuation
- Target: 1.08750 🎯 (≈ 35 pips from current price)
- Invalidation if price breaks above descending trendline and holds
Reasoning:
- Descending triangle often leads to breakdowns when tested multiple times
- Lower highs show sellers gaining control
- Short bias remains as long as price respects the triangle resistance
(Personal chart study, not financial advice)
AUDNZD: Short Signal Explained
AUDNZD
- Classic bearish formation
- Our team expects fall
SUGGESTED TRADE:
Swing Trade
Sell AUDNZD
Entry Level - 1.0926
Sl - 1.0929
Tp - 1.0920
Our Risk - 1%
Start protection of your profits from lower levels
Disclosure: I am part of Trade Nation's Influencer program and receive a monthly fee for using their TradingView charts in my analysis.
❤️ Please, support our work with like & comment! ❤️

AUD-NZD Rebound Ahead! Buy!
Hello,Traders!
AUD-NZD made a retest
Of the wide horizontal support
Level again at 1.0909 and we
Are already seeing a bullish
Reaction so a local bullish
Rebound can be expected
Buy!
Comment and subscribe to help us grow!
Check out other forecasts below too!
Disclosure: I am part of Trade Nation's Influencer program and receive a monthly fee for using their TradingView charts in my analysis.

NZD/AUD update for the weekend and trade management ideas.Both the main and add-on positions are in a secure spot and can be protected by tightening the stop loss if one chooses. In the longer-term picture, the analysis is the same. I am expecting this to complete the push to the top of this channel. We could exit now around 1.7 : 1 RR. Not bad for a trade taken a couple days ago, but I like the hold here personally.

AUD/NZD Short Trade AUD/NZD Short position from a Daily Supply Zone.
A clear and impressive move away showing a clear sign of institutional selling.
My first publication so my explanations will need some work.
AUDNZD Trading Opportunity! BUY!
My dear subscribers,
This is my opinion on the AUDNZD next move:
The instrument tests an important psychological level 1.0952
Bias - Bullish
Technical Indicators: Supper Trend gives a precise Bullish signal, while Pivot Point HL predicts price changes and potential reversals in the market.
Target - 1.0961
My Stop Loss - 1.0947
About Used Indicators:
On the subsequent day, trading above the pivot point is thought to indicate ongoing bullish sentiment, while trading below the pivot point indicates bearish sentiment.
Disclosure: I am part of Trade Nation's Influencer program and receive a monthly fee for using their TradingView charts in my analysis.
———————————
WISH YOU ALL LUCK
AUDNZD LONG 7/8/2025Axy : bullish
zxy : bearish
trend : bullish
divergence : n/a
continuation : break of consolidation box
currently retracing
trade plan
buy limt

AUD/NZD BEARS ARE STRONG HERE|SHORT
Hello, Friends!
AUD-NZD uptrend evident from the last 1W green candle makes short trades more risky, but the current set-up targeting 1.093 area still presents a good opportunity for us to sell the pair because the resistance line is nearby and the BB upper band is close which indicates the overbought state of the AUD/NZD pair.
Disclosure: I am part of Trade Nation's Influencer program and receive a monthly fee for using their TradingView charts in my analysis.
✅LIKE AND COMMENT MY IDEAS✅

AUDNZD still bullish trend expecting
OANDA:AUDNZD last five analysis accurate (attached), here is new view on AUDNZD, still bullish expecting, price is not break strong zone, bouncing - pushing strongly from same, looks like DESCENDING CHANNEL is breaked.
Here still bullish expectations having.
SUP zone: 1.09100
RES zone: 1.10300, 1.10600

AUDNZD Technical Analysis! SELL!
My dear friends,
AUDNZD looks like it will make a good move, and here are the details:
The market is trading on 1.0935 pivot level.
Bias - Bearish
Technical Indicators: Supper Trend generates a clear short signal while Pivot Point HL is currently determining the overall Bearish trend of the market.
Goal - 1.0928
Recommended Stop Loss - 1.0939
About Used Indicators:
Pivot points are a great way to identify areas of support and resistance, but they work best when combined with other kinds of technical analysis
Disclosure: I am part of Trade Nation's Influencer program and receive a monthly fee for using their TradingView charts in my analysis.
———————————
WISH YOU ALL LUCK

Trade management for NZD/AUDThe US-EU trade deal boosted USD demand and jolted FX markets at the open. This, coupled with low liquidity during the Monday Asian session caused a gap in this pair. Our short term trade was taken out at break even, while our medium term trade narrowly survived. This was a technical play in an odd pair, opportunistic while doing some charting :) I took profit at 1:1 and will wait to deploy capital elsewhere.


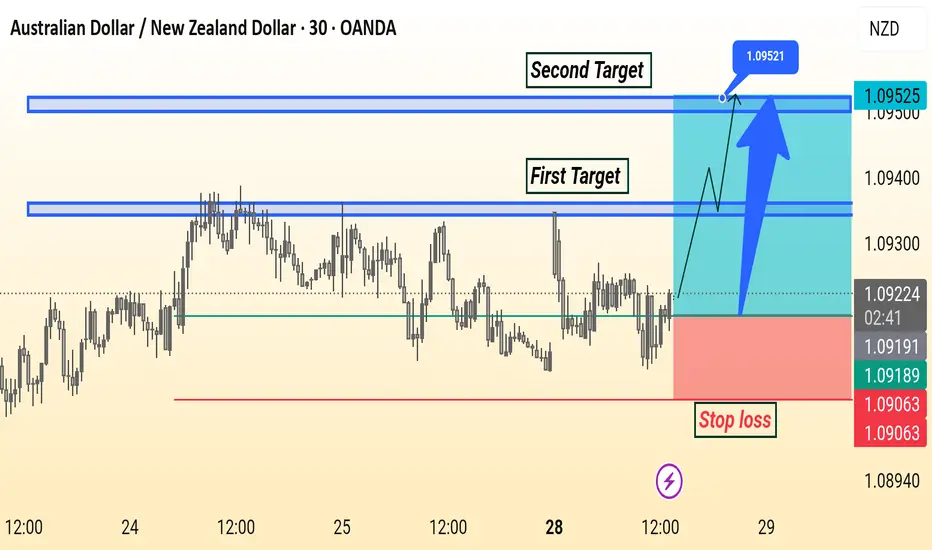
AUD/NZD Analysis is Ready Move Will Be Fly This AUD/NZD 30-minute chart shows a bullish setup with entry around 1.09216. The first target is near 1.09400 and the second target is at 1.09521. A stop loss is placed below support at 1.09063. The analysis suggests a potential upward move after a breakout.
AUDNZD: Bullish Continuation & Long Trade
AUDNZD
- Classic bullish formation
- Our team expects growth
SUGGESTED TRADE:
Swing Trade
Buy AUDNZD
Entry Level - 1.0913
Sl - 1.0909
Tp - 1.0920
Our Risk - 1%
Start protection of your profits from lower levels
Disclosure: I am part of Trade Nation's Influencer program and receive a monthly fee for using their TradingView charts in my analysis.
❤️ Please, support our work with like & comment! ❤️

AUD-NZD Local Long! Buy!
Hello,Traders!
AUD-NZD is about to retest
A strong horizontal support
Level of 1.0912 and as we are
Bullish biased we will be expecting
A local bullish rebound
Buy!
Comment and subscribe to help us grow!
Check out other forecasts below too!
Disclosure: I am part of Trade Nation's Influencer program and receive a monthly fee for using their TradingView charts in my analysis.
