Stealing Pips Like a Pro – AUD/NZD Long Heist, MA Breakout Setup🎯 AUD/NZD Heist: Bullish Bank Robbery 🚀💰 (Thief Trading Style)
🌟 Hi! Hola! Ola! Bonjour! Hallo! Marhaba! 🌟
Dear Money Makers & Robbers, 🤑💸✈️
Based on 🔥Thief Trading Style🔥 (technical + fundamental analysis), here’s our master plan to loot the AUD/NZD "Aussie vs Kiwi" Forex Bank!
🔎 The Heist Setup (Long Entry Focus)
🐂 Bullish Breakout Strategy:
Entry: Wait for MA breakout (1.08150) then strike!
Alternative Entry: Place Buy Stop above MA OR Buy Limit near pullback zones (15-30min timeframe).
Pro Tip: Set an ALERT for breakout confirmation!
🛑 Stop Loss (Thief’s Safety Net):
"Yo, listen up! 🗣️ If you're entering via Buy Stop, don’t set SL until after breakout!
Thief’s SL Zone: Nearest swing low (1.07500 – 3H timeframe).
Adjust SL based on your risk, lot size, and trade plan.
🎯 Profit Targets:
1st Target: 1.08600 (or escape earlier if cops lurk!).
Scalpers: Only scalp LONG! Use trailing SL to protect gains.
⚠️ Critical Heist Rules:
Avoid news chaos! 🚨 No new trades during high-impact news.
Lock profits with trailing stops.
Cops (Bears) are strong near resistance – don’t get caught!
💥 Boost the Heist!
💖 Hit the "Boost" button to strengthen our robbery squad! More likes = more 💰easy money heists!
Stay tuned for the next big steal! 🏆🚀🐱👤
AUDNZD trade ideas


decisive moment for AUDNZD !! a broken trendline , after last LL price made support level and after that we can see a upward movement these confluences suggest that AUDNZD is going to start bullish rally currently the price is retracing and testing the drawn trendline. instant buy with SL just below the support zone or try to find bullish divergence on 30min or 15min tf and and then trade accordingly

AUDNZD short movePrice is rising towards our supply zone, any bearish reaction can lead fall in price.

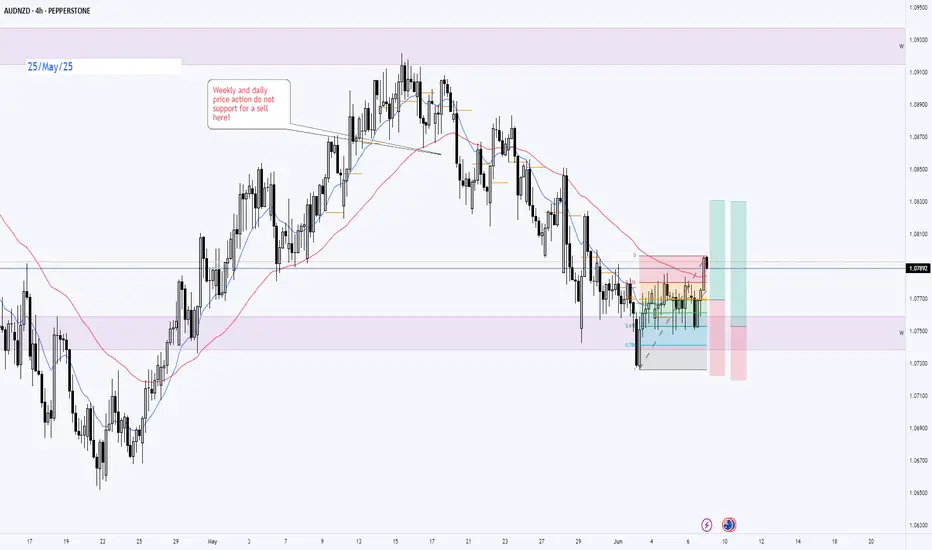
AUDNZD Bearish Trend: Short Setup at Key Fib Levels?Hello traders! 👋 Diving into AUDNZD today.
Despite a recent bounce from the weekly order block and the weekly 0.618 Fibonacci level, the overriding trend remains strongly bearish on both the Daily and 4-hour timeframes. 📉 This keeps shorts on my radar.
🔍 Short Setup Considerations:
I'm considering short positions based on the following scenarios:
Scenario A: If the price reaches the 0.618 Fibonacci retracement level accompanied by a liquidity sweep above a recent high.
Scenario B: Should the 0.618 level be breached, a short could be considered if the price then reaches the next 0.786 Fibonacci retracement level . Here, I'd look for a clear liquidity sweep and a subsequent reversal reaction from this level.
🎯 Potential Short Entry Zone: 1.0780 – 1.0800
I'll be patiently watching for price action to confirm one of these setups before considering an entry. Confirmation is key!
Remember to trade wisely and manage your risk.

AUDNZD 09/06/2025Weekly:
-OB.
-Liquidity sweep.
-Weekly low acting as support.
Daily:
-Inverse H&S pattern.
-Bullish M pattern.
-IC.
4H:
-Bullish M pattern.

AUDNZD: Long Trade Explained
AUDNZD
- Classic bullish formation
- Our team expects growth
SUGGESTED TRADE:
Swing Trade
Buy AUDNZD
Entry Level - 1.0766
Sl - 1.0740
Tp - 1.0812
Our Risk - 1%
Start protection of your profits from lower levels
Disclosure: I am part of Trade Nation's Influencer program and receive a monthly fee for using their TradingView charts in my analysis.
❤️ Please, support our work with like & comment! ❤️

AUDNZD | XABCD PatternAUDNZD is clearly printing XABCD pattern which indicates bullish reversal from PRZ.We may take short trade after its breaking point B with SL at point C.After reversal we may againg ride a bullish trend after its breaking of first HH.


AUDNZDCurrent 10-Year Bond Yields (June 1–10, 2025)
Australia: The 10-year government bond yield rose to approximately 4.34% on June 6, 2025, after a slight increase from earlier levels around 4.53% in late May 2025. The Reserve Bank of Australia (RBA) recently cut the cash rate to 3.85%, contributing to some volatility in yields.
New Zealand: The 10-year government bond yield was about 4.64% on June 6, 2025, slightly up from around 4.59% at the end of May 2025. New Zealand’s official cash rate stands at 3.50% as of April 2025.
Interest Rate Differential
The 10-year bond yield differential between New Zealand and Australia is roughly:
4.64%−4.34%=0.30%
This means New Zealand’s 10-year bonds yield about 30 basis points more than Australia’s.
The policy interest rate differential is about:
3.50%(NZ)−3.85%(AU)=−0.35%,
indicating Australia’s cash rate is currently higher by 35 basis points.
Uncovered Interest Rate Parity (UIP) Implications
UIP theory states that the expected change in the exchange rate between two currencies equals the interest rate differential between their countries E =iNZ−iAUE =i NZ−i AU
Using the policy rate differential (-0.35%), UIP would imply the NZD should depreciate against the AUD by about 0.35% over the relevant horizon.
Using the 10-year bond yield differential (+0.30%), UIP would imply the NZD should appreciate against the AUD by about 0.30%.
The conflicting signals reflect that short-term rates favor AUD while long-term yields slightly favor NZD. In practice, exchange rates are influenced by risk premiums, growth expectations, and monetary policy outlooks beyond pure UIP.
Key Upcoming June 2025 Economic Data (Australia and New Zealand)
Australia:
Inflation rate update (next CPI release)
Employment and unemployment data for May 2025
Retail sales and business confidence reports
RBA’s monetary policy statement and any forward guidance on rates
New Zealand:
Inflation expectations and Q2 CPI data
Unemployment rate and labor market reports
Trade balance and manufacturing PMI
RBNZ commentary on interest rates and inflation outlook
These economic releases will be critical for shaping market expectations on future interest rates and yield curves, thereby impacting the AUD/NZD exchange rate.
Summary
Metric Australia New Zealand Differential (NZ - AU)
10-Year Bond Yield ~4.34% (June 6, 2025) ~4.64% (June 6, 2025) +0.30%
Policy Interest Rate 3.85% (May 2025) 3.50% (April 2025) -0.35%
UIP Expected Exchange Rate — — Mixed signals (±0.3%)
Key June Data Inflation, employment, RBA policy Inflation, labor market, RBNZ guidance
The slightly higher long-term yields in New Zealand versus higher short-term rates in Australia create nuanced dynamics for AUD/NZD parity. The final exchange rate direction will depend on upcoming economic data releases and central bank communications in June 2025.
In conclusion, while New Zealand’s slightly higher 10-year bond yields create a positive interest rate differential over Australia, the strong economic ties and global influences mean that Australian bond yield changes materially affect New Zealand yields. This dynamic plays a significant role in shaping the AUD/NZD exchange rate through interest rate parity and market expectations
#AUDNZD #FOREX

AUDNZD buy setupHi traders. My view on this one, price is approaching a weekly demand zone which aligns with a strong support level.
Please let me know what you think.

NNFX AUDNZD Short - Full Signal DelayedSignal: AUDNZD Short — Full Signal Delayed
Context: C1 signal, C2 2 days ago
Probability: Normal
Risk: 0.5% → C2 signal 2 days ago, all other indicators align. Volume is short.
R:R Plan: 1.3R, 75% scale-out at 1xATR TP for lower probability & drawdown management.
---
Notes:
Again, this is a trade I would not normally take, however, market gapped considerably below the close of the candle which my C1 triggered. The original candle where my C1 should have triggered if this was to be a full signal on time, was literally 1-2 pips away from triggering. Price had then pulled back on the next day, then gone short again on this day, triggering the C1.
Due to an order block sitting about 15 pips below price, I also would have used a pending order to enter the market which would not have been triggered until today.
Given this circumstance, and the gift of hindsight, this would have been a missed signal if I did not enter. I managed to enter at the same price I would have if the trade was completed 2 days ago but reduced risk to 0.5% to be cautious.

AUDNZD: Long Signal with Entry/SL/TP
AUDNZD
- Classic bullish formation
- Our team expects pullback
SUGGESTED TRADE:
Swing Trade
Long AUDNZD
Entry - 1.0769
Sl - 1.0744
Tp - 1.0819
Our Risk - 1%
Start protection of your profits from lower levels
Disclosure: I am part of Trade Nation's Influencer program and receive a monthly fee for using their TradingView charts in my analysis.
❤️ Please, support our work with like & comment! ❤️

AUD_NZD BEARISH BREAKOUT|SHORT|
✅AUD_NZD made a bearish
Breakout of the key horizontal
Level of 1.0783 and the breakout
Is confirmed so we are locally
Bearish biased and we will be
Expecting a further bearish
Move down
SHORT🔥
✅Like and subscribe to never miss a new idea!✅
Disclosure: I am part of Trade Nation's Influencer program and receive a monthly fee for using their TradingView charts in my analysis.

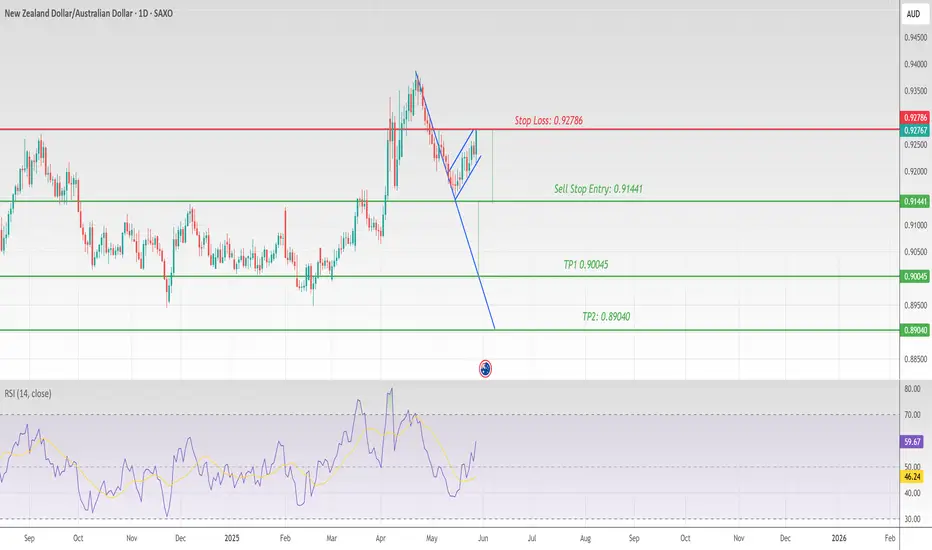
NZDAUD 1 Daily Chart Bearish Flag Continuation PatternNZDAUD 1 Daily Chart Bearish Flag Continuation Pattern
Stop Loss: 0.92786
Sell Stop Entry: 0.91441
TP1 0.90045
TP2: 0.89040
No Divergence
AUD/NZD - Strong Bullish Trade Setup🔥 AUD/NZD 8H Bullish Setup – Demand Zone + Liquidity Grab
📍 Current Structure:
Price is pulling back into a refined demand zone, perfectly aligned with the 71% Fibonacci retracement.
This zone also holds trendline support from the higher timeframe — strong structural confluence.
Price is forming a corrective wave, likely completing a classic ABC pattern down into demand.
📊 Volume Insight:
A volume spike at the lows hints at aggressive buying — likely institutional.
Smart money may be accumulating just before a bullish push.
📈 Play Idea:
Looking for price to react inside the 71% zone, potentially forming a bullish engulfing or BOS (break of structure).
Clear target is Buy Side Liquidity (BSL) above recent highs — that's where stops are clustered.
🧠 Confluences:
Demand Zone ✅
71% Fib Level ✅
Trendline Support ✅
Volume Spike ✅
Buy Side Liquidity Target ✅
🎯 Bias: Strongly Bullish
Waiting for a clean trigger — bullish candle confirmation or BOS.
This setup screams smart money accumulation.

AUDNZD-H1-SHORTThe price, previously supported by ascending trendlines, has recently broken below these lines, signaling a potential reversal in momentum. The Ichimoku cloud (Kumo) highlights critical support and resistance zones, with the price moving outside the cloud, reinforcing the breakdown of the prior uptrend. The Tenkan-sen and Kijun-sen lines confirm this shift through their crossover, aligning with the wave structure and indicating a bearish turn. This setup suggests an opportunity for a short position, as the market may be entering a consolidation or downtrend phase.
If you liked this analysis, hit the BOOST !

AUDNZDAUDNZD is showing strong bearish momentum, with clear lower highs and lower lows forming on the 5-minute and 15-minute charts. Price has broken through key intraday support with increased volume, confirming strong seller presence. Momentum indicators support further downside, suggesting an ideal short scalp opportunity as the trend continues.

AUDNZD Bullish Setup: Potential Reversal in ProgressWeekly Overview:
Price is holding well at a key weekly support zone, forming a strong rejection candle—indicating buyer interest stepping in at this level.
Daily Chart:
We are seeing consistent bullish pressure with four consecutive bullish candles. This is a good sign that momentum is building on the buy side.
4H Chart:
Price action has decisively broken the downtrend line, pierced above minor resistance levels, and successfully cleared the 50EMA—confirming a potential shift to bullish structure. 📈
Plan:
🔹 Bias: Bullish
🔹 Entry: Wait for retracement to discounted zone or confirmation candle above broken resistance
🔹 Targets:
‣ TP1: Previous 4H high
‣ TP2: Daily resistance zone
🔹 Invalidation: A break back below the 4H 50EMA and trendline support
AUD/NZD - Weekly Time frame Analysis📌 Technical Breakdown:
✅ Liquidity Sweep just occurred below previous lows, clearing weak long positions — a classic reversal signal.
🔂 Price tapped into a major weekly demand zone around the 1.04150 – 1.05000 range.
🔁 Strong reaction after hitting the 71% Fibonacci retracement, showing institutional buying.
🧱 Previous imbalance has been filled; structure now favoring a bullish continuation.
📈 The target: Buy-side liquidity above 1.10200 where price previously reversed with imbalance.
📊 Volume confirmed by a spike post-sweep — buyers are stepping in.
🎯 High-Probability Trade Setup:
Entry Zone: 1.0500 – 1.0600
Stop Loss: Below 1.0390 (beneath liquidity zone and fib invalidation)
Take Profit Target: 1.1000 – 1.1050
Risk-to-Reward: ~1:4+ depending on entry confirmation
🔮 Expectation:
Price may form a higher low retest around 1.0600 before launching.
A confirmed break above the imbalance at 1.0830 would unlock clean momentum toward buy-side targets.
🧠 Final Note:
This is a classic demand + liquidity + fib reversal setup on the weekly — ideal for a mid-to-long-term swing position with fundamental and technical alignment. Confirmation from daily/4H time frames can optimize your entry timing.


AUDNZD: Bulls Will Push
It is essential that we apply multitimeframe technical analysis and there is no better example of why that is the case than the current AUDNZD chart which, if analyzed properly, clearly points in the upward direction.
Disclosure: I am part of Trade Nation's Influencer program and receive a monthly fee for using their TradingView charts in my analysis.
❤️ Please, support our work with like & comment! ❤️
