AUDNZD: Ongoing Reversal from ResistanceI am watching for a reversal on AUDNZD as marked on my chart, expecting a reversal with a downside target at around 1.08700.
This is a high probability setup taken into account the overextended upside move to this resistance zone.
Just sharing my thoughts for the charts, this isn’t financial advice. Always confirm your setups and manage your risk properly.
AUDNZD trade ideas

AUDNZD Short-sell IdeaAfter price made a BOS (Break of Structure), it entered a correction phase. Possibly we are looking at a short around the supply zone.

Audnzd buy Audnzd is looking rdy for recoil back north , current pullback is landing in a poi buy area, the current trend is up and we should be looking for potential buy signals around here . Stay vigilant here

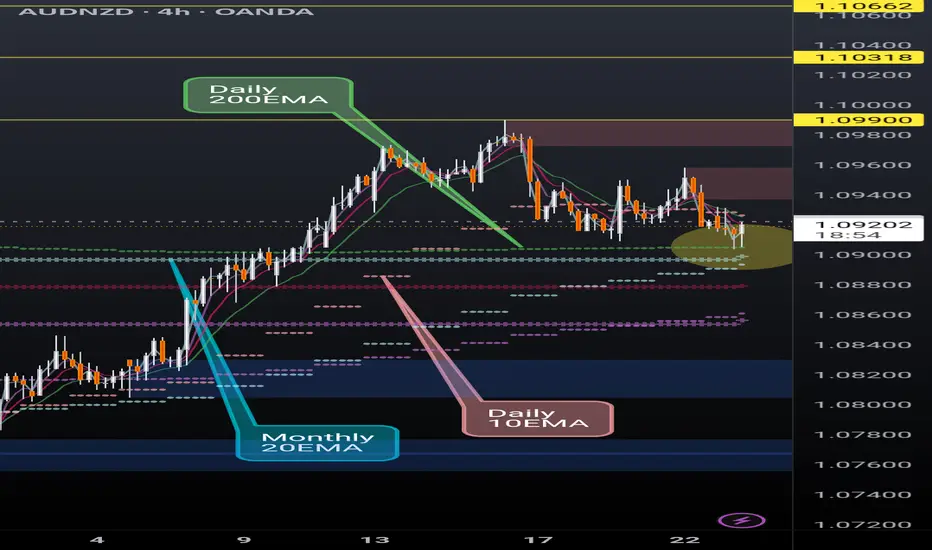
AUDNZD finding support on critical EMAsAUDNZD is finding support at the daily 200EMA (overlayed on 4H chart) and, more significantly, above the monthly 20EMA (overlayed). Break and hold the daily 10EMA (overlayed) will be key.
If the momentum continues we could see a continuation of the ongoing rally however recent AUD monetary policy meeting minutes seemed to lean dovish.
I'm a cat not a financial advisor.
AUD-NZD Local Long! Buy!
Hello,Traders!
AUD-NZD is about to retest
A strong horizontal support
Level of 1.0912 and as we are
Bullish biased we will be expecting
A local bullish rebound
Buy!
Comment and subscribe to help us grow!
Check out other forecasts below too!
Disclosure: I am part of Trade Nation's Influencer program and receive a monthly fee for using their TradingView charts in my analysis.

NZD/AUD We were at the bottom of a longer term ABC correction, so on the one-hour we waited for the impulse which we got around 7/16 and then the correction which ended on 7/22 at the trendline. Trade entered on 15 minute time frame, and it is timeto move the stop loss to break even.

AUDNZD: Bullish Move After Breakout📈AUDNZD has surpassed and closed above a key horizontal daily resistance level.
After retesting this broken structure, the price rebounded and broke above a resistance line of a falling wedge pattern, suggesting a strong likelihood of a bullish trend resumption.
The price is expected to reach the 1.0977 level soon.

AUDNZD Short Setup - CAB EntrySellers stepping in, strong reversal impulse. Waiting for a slight correction before taking a short entry on the LTF.
Good Luck
AUD/NZDAccording to the COT report this pair is selling this week with a break of a support zone which is now a major resistance zone.
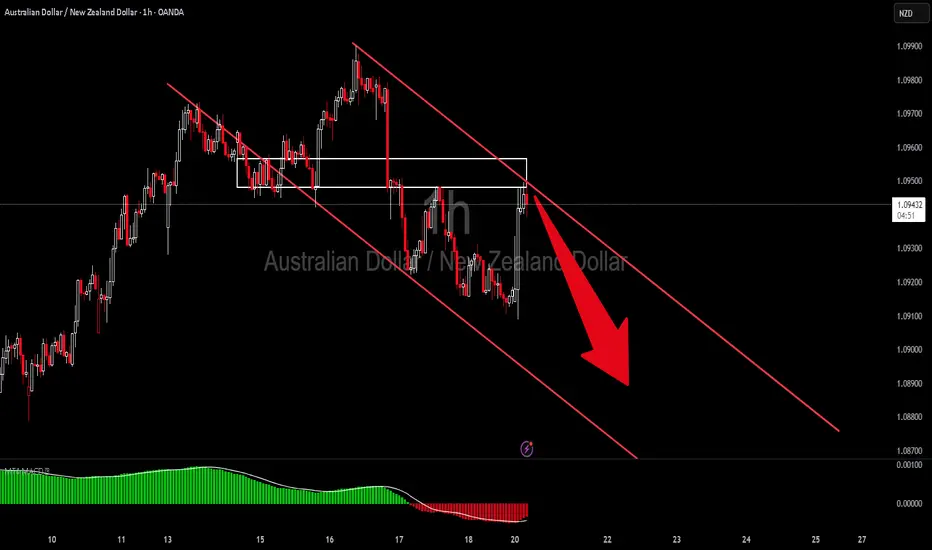
AUDNZD Channel Trading Scenario AUDNZD is Trading down trend and the Price rejected from he recent resistance trendline and is likely go down.

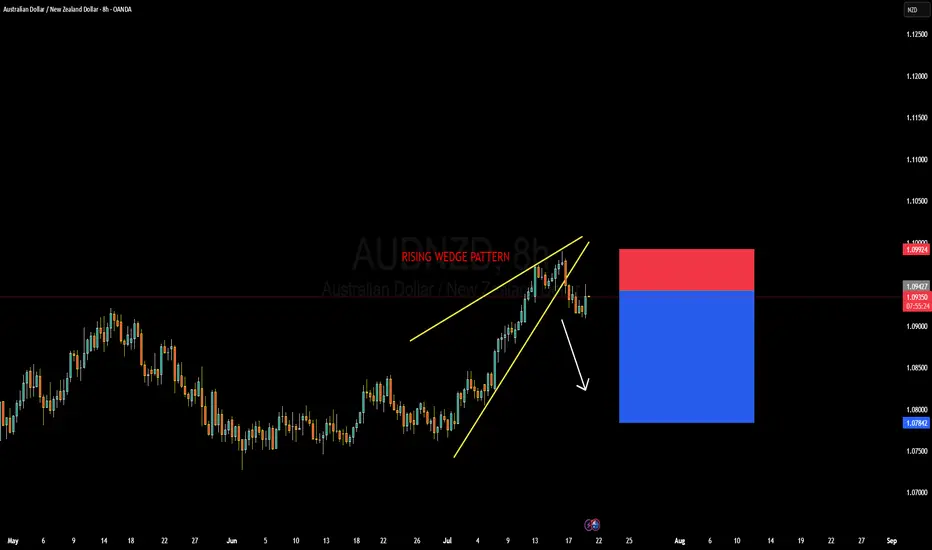
AUDNZD Forming Rising Wedge PatternAUDNZD has formed a textbook rising wedge pattern on the 8H chart and has now broken to the downside, signaling potential bearish continuation. This setup typically indicates a loss of momentum in the prevailing bullish trend, and with the clean structure break now confirmed, the bears seem ready to take control. I’ve already entered short positions from the top edge of the pattern and am currently floating in profit, anticipating further downside toward the 1.0780–1.0800 zone.
From a fundamental perspective, the Australian dollar has been relatively stable but lacks a strong bullish catalyst at this point. The Reserve Bank of Australia is holding a cautious tone amid mixed inflation signals, while New Zealand’s economy is showing signs of potential resilience. The RBNZ remains committed to tighter monetary conditions for longer as inflation continues to hover above their comfort zone, which provides some support to NZD in the near term.
Technically, the break of the lower wedge support is significant. Price failed to sustain higher highs near 1.1000 and quickly retraced, showing bearish rejection. With the RSI diverging and volume fading near the top of the wedge, this was a high-probability reversal zone. As long as price stays below 1.0950, the bias remains bearish, and further sell pressure is expected.
I'm targeting 1.0780 as the next key liquidity level. It aligns with previous structure support and provides a favorable risk-to-reward setup. This setup is a clear example of price-action-driven reversal trading, paired with macroeconomic alignment. I’ll continue to trail stops as price progresses, but so far, AUDNZD is playing out exactly as anticipated.
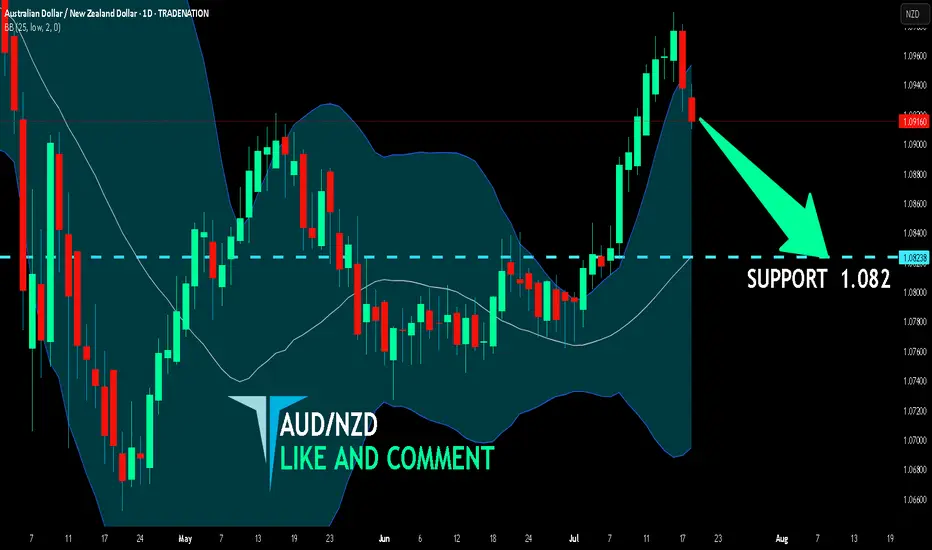
AUD/NZD SHORT FROM RESISTANCE
Hello, Friends!
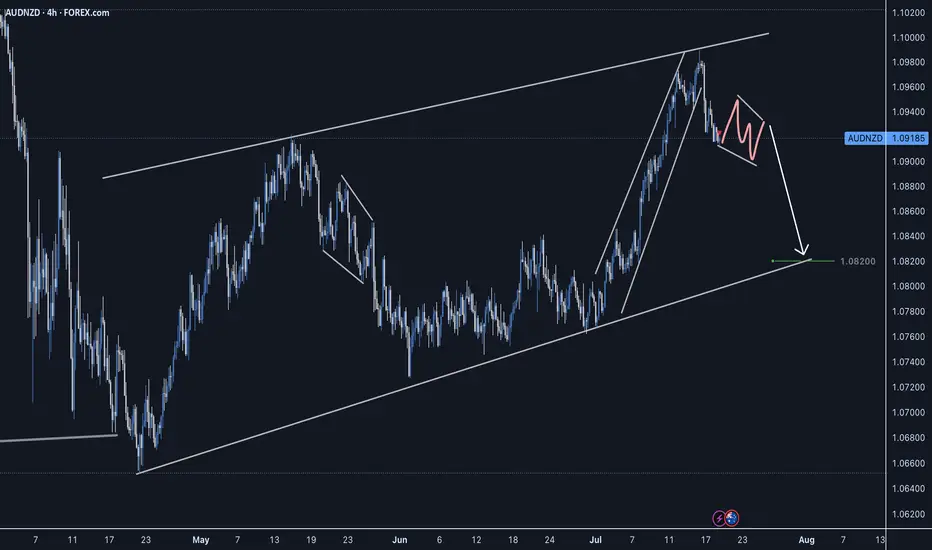
The BB upper band is nearby so AUD/NZD is in the overbought territory. Thus, despite the uptrend on the 1W timeframe I think that we will see a bearish reaction from the resistance line above and a move down towards the target at around 1.082.
Disclosure: I am part of Trade Nation's Influencer program and receive a monthly fee for using their TradingView charts in my analysis.
✅LIKE AND COMMENT MY IDEAS✅
BULLISH BIASPrice previously broke upper structure to form new high before a pullback to support to sweep liquidity.
Right now, support having been touched became a demand zone pushing price up.
Price incidentally came back down to it's present zone to form double bottom which right now is a goid place to enter buy and target new high as take profit.

audnzd long trade in my opinion this is a good trade with a good r/r hope hit the tp consider this is my trade not your trade and i just like to share my trades with world

AUDNZD Breakout: Long Opportunity in Ascending ChannelToday I want to share with you a Long position opportunity in AUDNZD ( OANDA:AUDNZD ).
Let's first take a brief look at the AUDNZD fundamentals .
RBNZ kept rates at 3.25% , signaling likely further cuts in August.
RBA paused at 3.60% , but dovish bias remains; markets expect more easing ahead.
As NZD is more pressured by immediate rate cuts than AUD, the fundamental setup favors a bullish AUDNZD.
Now let's find a long position for AUDNZD using technical analysis .
AUDNZD seems to have managed to break through the Heavy Resistance zone(1.0963 NZD-1.0870 NZD) and is moving near the Support zone(1.0964 NZD-1.0954 NZD) on the 1-hour time frame .
AUDNNZD is also moving in an Ascending Channel .
I expect AUDNZD to rise at least to the Resistance lines , the second target is the Resistance zone(1.103 NZD-1.0993 NZD).
Note: Stop Loss(SL): 1.0944 NZD
Please respect each other's ideas and express them politely if you agree or disagree.
Australian Dollar/New Zealand Dollar Analyze (AUDNZD), 1-hour time frame.
Be sure to follow the updated ideas.
Do not forget to put a Stop loss for your positions (For every position you want to open).
Please follow your strategy and updates; this is just my Idea, and I will gladly see your ideas in this post.
Please do not forget the ✅' like '✅ button 🙏😊 & Share it with your friends; thanks, and Trade safe.

AUDNZD BUY OPPORTUNITY Price trend remains bullish as market dropped from the high of 1.09866 without making a new higher low. A buy opportunity is envisaged from the current market price.

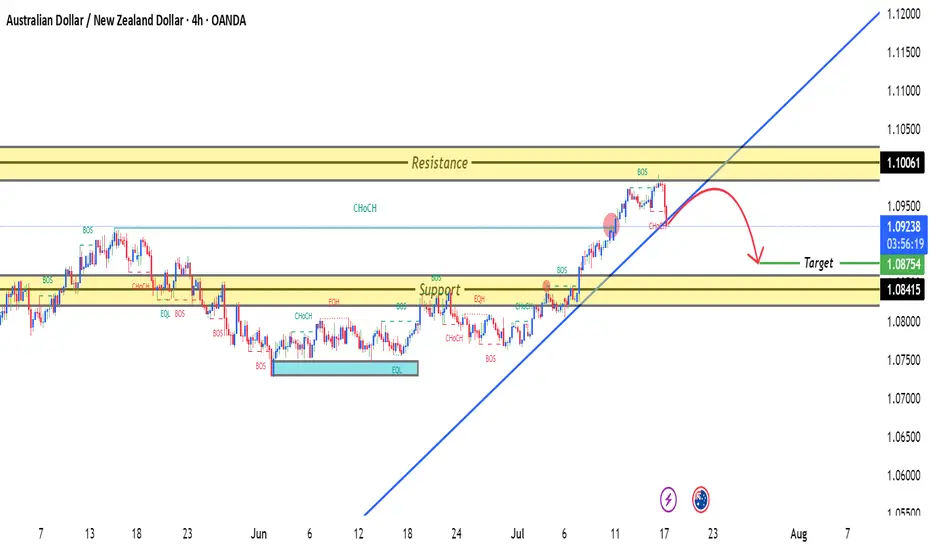
AUDNZD - Short-Term Pullback Expected from Key ResistanceAUDNZD - Short-Term Pullback Expected from Key Resistance
📈 Setup Overview:
AUDNZD has been trending bullish but has now reached a critical resistance level that aligns with the upper boundary of the ascending trendline. This confluence suggests a potential short-term pullback opportunity.
🔍 Analysis:
Strong bullish wave structure intact
Price testing key resistance + ascending trendline upper boundary
Expecting retracement toward trendline support
Overall bullish structure remains favorable for continuation after pullback
📊 Trade Details:
Entry: Sell Stop at 1.091745
Risk Management: 1:2 Risk-to-Reward Ratio
Bias: Short-term bearish pullback within larger bullish trend
⚠️ Risk Disclaimer: This is not financial advice. Trade at your own risk and always use proper position sizing.

AUDNZD 4H TIME FRAME ANALYSISAUDNZD is currently in a short-term downtrend on the 4-hour chart. Price has been forming lower highs and lower lows, confirming bearish pressure. Recent candles show rejection at higher levels, supporting downside continuation.
1.09400 – 1.09550: Strong resistance zone where price was previously rejected multiple times.
1.09380 (your entry) aligns with a minor lower high, reinforcing this level as a valid sell area.
AUDNAZD at the Trendline resistance AUDNZD has recently been trending in a bullish wave. However, the pair has reached a key resistance level aligned with the upper boundary of the ascending trendline. This suggests a potential short-term pullback. Price action indicates that AUDNZD may retrace towards the trendline support before resuming its upward movement in alignment with the prevailing bullish structure.
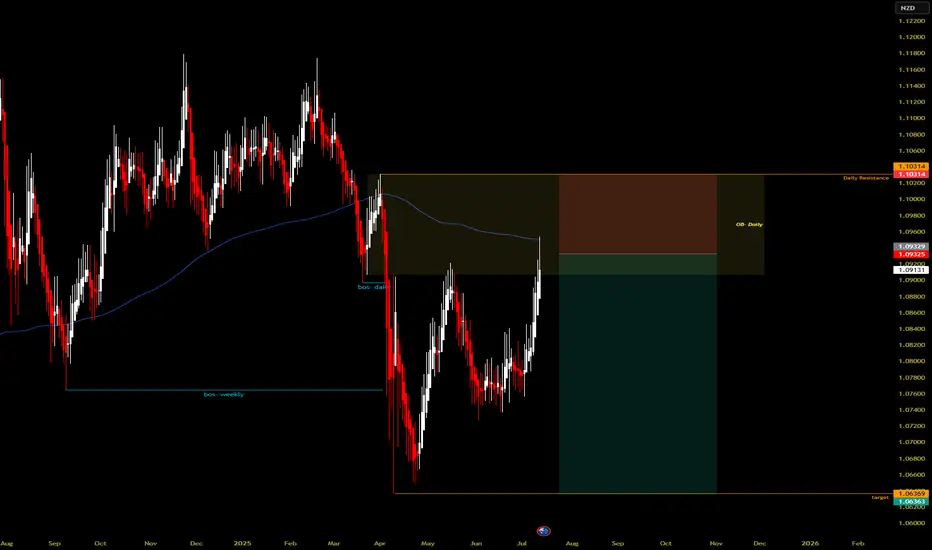
[SHORT] AUDNZD bearish COT DATAAUDNZD showed lots of institutional selling last COT Friday data.
200-MA touch
Bearish Daily break of structure.
Supply Zone area.
Im opening a swing short position targeting the lows @ 1.06369
Risk 1% target 3%
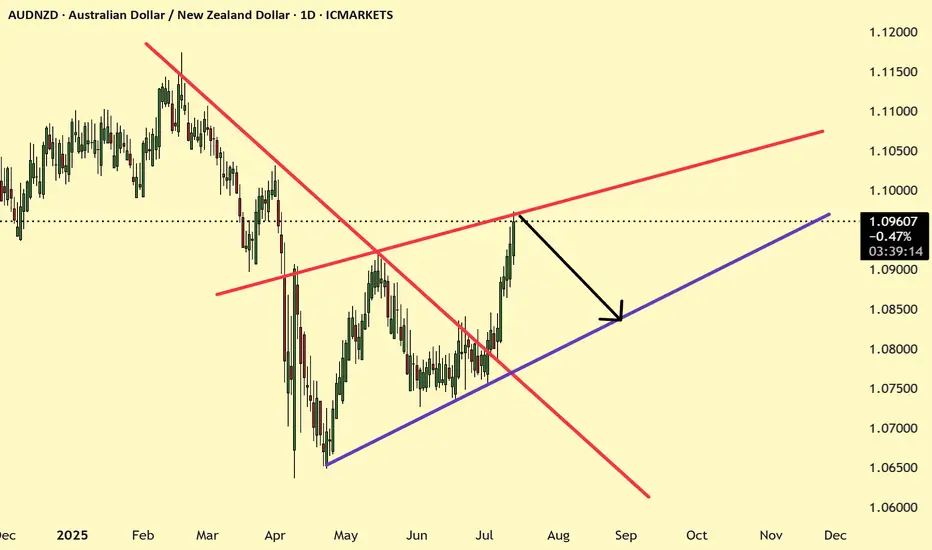
AUDNZD - sentiments Bullish - BUY AUDNZD is trending in bullish trend with HH and HL. Market has took correction from fib level of 0.382-0.5 which is a good support level. Futher, market has shown channel which is a continuation pattern.
we can instant enter in the market with our SL below last HL. Targets are TP1 and TP2 with a R:R of 1:1 and 1:2.

Stealing Pips Like a Pro – AUD/NZD Long Heist, MA Breakout Setup🎯 AUD/NZD Heist: Bullish Bank Robbery 🚀💰 (Thief Trading Style)
🌟 Hi! Hola! Ola! Bonjour! Hallo! Marhaba! 🌟
Dear Money Makers & Robbers, 🤑💸✈️
Based on 🔥Thief Trading Style🔥 (technical + fundamental analysis), here’s our master plan to loot the AUD/NZD "Aussie vs Kiwi" Forex Bank!
🔎 The Heist Setup (Long Entry Focus)
🐂 Bullish Breakout Strategy:
Entry: Wait for MA breakout (1.08150) then strike!
Alternative Entry: Place Buy Stop above MA OR Buy Limit near pullback zones (15-30min timeframe).
Pro Tip: Set an ALERT for breakout confirmation!
🛑 Stop Loss (Thief’s Safety Net):
"Yo, listen up! 🗣️ If you're entering via Buy Stop, don’t set SL until after breakout!
Thief’s SL Zone: Nearest swing low (1.07500 – 3H timeframe).
Adjust SL based on your risk, lot size, and trade plan.
🎯 Profit Targets:
1st Target: 1.08600 (or escape earlier if cops lurk!).
Scalpers: Only scalp LONG! Use trailing SL to protect gains.
⚠️ Critical Heist Rules:
Avoid news chaos! 🚨 No new trades during high-impact news.
Lock profits with trailing stops.
Cops (Bears) are strong near resistance – don’t get caught!
💥 Boost the Heist!
💖 Hit the "Boost" button to strengthen our robbery squad! More likes = more 💰easy money heists!
Stay tuned for the next big steal! 🏆🚀🐱👤

NZD/AUD update for the weekend and trade management ideas.Both the main and add-on positions are in a secure spot and can be protected by tightening the stop loss if one chooses. In the longer-term picture, the analysis is the same. I am expecting this to complete the push to the top of this channel. We could exit now around 1.7 : 1 RR. Not bad for a trade taken a couple days ago, but I like the hold here personally.
