AUD/NZD "Aussie vs Kiwi" Forex Market Heist Plan🌟Hi! Hola! Ola! Bonjour! Hallo! Marhaba!🌟
⚔Dear Money Makers & Thieves, 🤑 💰✈️
Based on 🔥Thief Trading style technical and fundamental analysis🔥, here is our master plan to heist the AUD/NZD "Aussie vs Kiwi" Forex Market. Please adhere to the strategy I've outlined in the chart, which emphasizes short entry. Our aim is the high-risk Green Zone. Risky level, oversold market, consolidation, trend reversal, trap at the level where traders and bullish thieves are getting stronger. 🏆💸Book Profits Be wealthy and safe trade.💪🏆🎉
Entry 📈 : "The heist is on! Wait for the breakout (1.09900) then make your move - Bearish profits await!" however I advise placing Sell Stop Orders below the breakout MA or Place Sell limit orders within a 15 or 30 minute timeframe. Entry from the most recent or Swing high or low level should be in retest.
📌I strongly advise you to set an alert on your chart so you can see when the breakout entry occurs.
Stop Loss 🛑: Thief SL placed at (1.10500) swing Trade Basis Using the 4H period, the recent / swing high or low level.
SL is based on your risk of the trade, lot size and how many multiple orders you have to take.
🏴☠️Target 🎯: 1.09400 (or) Escape Before the Target
🧲Scalpers, take note 👀 : only scalp on the Short side. If you have a lot of money, you can go straight away; if not, you can join swing traders and carry out the robbery plan. Use trailing SL to safeguard your money 💰.
AUD/NZD "Aussie vs Kiwi" Forex Market is currently experiencing a Neutral trend (higher chance to 🐻🐼Bearishness)., driven by several key factors.
📰🗞️Get & Read the Fundamental, Macro Economics, COT Report, Quantitative Analysis, Intermarket Analysis, Sentimental Outlook, Future Trend Move:
Before start the heist plan read it.👉👉👉
📌Keep in mind that these factors can change rapidly, and it's essential to stay up-to-date with market developments and adjust your analysis accordingly.
⚠️Trading Alert : News Releases and Position Management 📰 🗞️ 🚫🚏
As a reminder, news releases can have a significant impact on market prices and volatility. To minimize potential losses and protect your running positions,
we recommend the following:
Avoid taking new trades during news releases
Use trailing stop-loss orders to protect your running positions and lock in profits
💖Supporting our robbery plan 💥Hit the Boost Button💥 will enable us to effortlessly make and steal money 💰💵. Boost the strength of our robbery team. Every day in this market make money with ease by using the Thief Trading Style.🏆💪🤝❤️🎉🚀
I'll see you soon with another heist plan, so stay tuned 🤑🐱👤🤗🤩
AUDNZD trade ideas

Swing trade AUDNZD- Weekly plan- Long run for yearsWe reccomend for AN long run for years (2025-2027).
10 years+ sideway maybe end on half 2025. Take off and test 1.11 zone.
In previous AN has strong down trend (2012-2013).
We are estimate this uptrend take longer.
Hope all you best and catchup this trend!
Green pip to all!
#MakeCent #TradingMakeSense

AUDNZD Short-Term LongsHey traders, in the coming week, I'd be looking for short term buying opportunities from the marked demand zone. As we already know, market moves in waves- impulses and correction.
We've got a market that has printed a couple daily candles to the downside, and it's only normal to expect some form of correction. So ONLY UPON CONFIRMATION , would I be taking long trades from my POI.
#StayReactive

audnzd is bearishthe pair was trying several times to break the depicted level but failed and left a fake break on the level and now is heading south toward tp's
please see what the market will play out

AUD NZD SHORT Oportunity Entry: Short at the current market price around 1.10396, as the pair is approaching the resistance zone.
Stop Loss: Place your stop above 1.11800 to limit risk in case the resistance fails.
Take Profit: Target 1.07653, which offers a solid risk-to-reward ratio. This aligns with previous price action and key support levels.
Why This Makes Sense:
Resistance Confirmation: The 1.11800 resistance has been tested multiple times, and price seems to be struggling to break through.
Overbought Conditions: The SMI indicator suggests potential exhaustion of the current upward momentum, adding weight to the reversal theory.
Target Support: The 1.07653 level represents a reasonable support target based on recent price swings and previous lows.
As always, ensure proper risk management, and monitor the market for any further confirmation before executing the trade.
Good luck with your trading, and remember to stay disciplined!

AUDNZD LONG ReboundAUDNZD Rebound to the 60% fibbonacci level on daily timeframe. This is an entry against the trend. Moreover, we have Bullisgh divergence on RSI.

AUDNZD Wave Analysis – 20 March 2025
- AUDNZD reversed from key support level 1.0930
- Likely to rise to resistance level 1.0985
AUDNZD currency pair recently reversed up from the support zone between the key support level 1.0930 (former multi-month from December), support trendline of the daily down channel from February and the lower daily Bollinger Band.
The upward reversal from this support zone will likely form the daily Japanese candlesticks reversal pattern Morning Star – if the pair closes today near the current level.
Given the strength of the support level 1.0930 and the oversold daily Stochastic, AUDNZD currency pair can be expected to rise to the next resistance level 1.0985.

AUDNZD Sellers In Panic! BUY!
My dear friends,
AUDNZD looks like it will make a good move, and here are the details:
The market is trading on 1.0957 pivot level.
Bias - Bullish
Technical Indicators: Supper Trend generates a clear long signal while Pivot Point HL is currently determining the overall Bullish trend of the market.
Goal - 1.1005
Recommended Stop Loss - 1.0933
About Used Indicators:
Pivot points are a great way to identify areas of support and resistance, but they work best when combined with other kinds of technical analysis
———————————
WISH YOU ALL LUCK

AUDNZD Potential Bullish Cypher Hello guys, this is my view on AUDNZD. so I will update you guys as things progress on this trading opportunity either in a loss or in a profit.
Remember you are not in competition with anyone, is not about who is the best analyst. is all about making small/big consistent profits little by little over time.
Your personal encounter on the chart is going to be different from others. be real to yourself and trust yourself to make the right decision on the chart.
Love you all.

AUD is getting stronger over NZDAUD is getting stronger over NZD, a bullish momentum may be observed

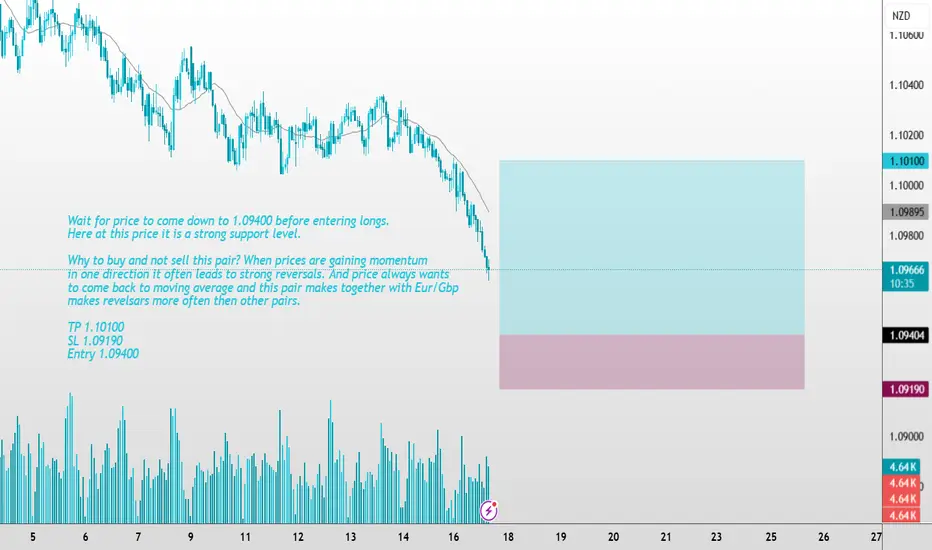
Aud/Nzd Longs Wait for price to come down to 1.09400 before entering longs. Here at this price it is a strong support level.
Why to buy and not sell this pair? When prices are gaining momentum in one direction it often leads to strong reversals. And price always wants to come back to moving average and this pair makes together with Eur/Gbp makes revelsars more often then other pairs.
TP 1.10100
SL 1.09190
Entry 1.09400
AUDNZD 12An easy trading setup: Wait for a pullback or enter directly, but direct entry carries higher risk.

AUD_NZD LONG SIGNAL|
✅AUD_NZD is going down to retest
A strong horizontal support of 1.0947
And the pair is clearly oversold
So after the price hits the support
We can go long on the pair expecting
A bullish correction with the
Take Profit of 1.0965 and
Stop Loss of 1.0939
LONG🚀
✅Like and subscribe to never miss a new idea!✅
Disclosure: I am part of Trade Nation's Influencer program and receive a monthly fee for using their TradingView charts in my analysis.

AUDNZD Finally Turning Bearish?AUDNZD pair turned sharply and impulsively down at the end of 2022, probably for wave A. Since the beginning of 2023, it’s been trading in a correction within a downtrend, ideally in a bigger ABC recovery within wave B, where we were observing subwave C as an ending diagonal/wedge pattern. We were actually tracking final subwave (5) of the wedge pattern within wave C of B that put the top in place, from where we saw a nice and sharp turn south which looks like an impulse into wave 1. So, after recent pullback in wave 2, the price action can resume within wave 3 of a five-wave bearish cycle, especially if we consider a broken lower wedge line.

AUDNZD Under Pressure - TA and Trade IdeaAUDNZD is facing selling pressure, as evident on the daily timeframe 📉. In this video, we analyze key support and resistance levels 📊 and explore a potential trade setup based on technical analysis, market structure, price action, and other critical factors. As always, this is not financial advice.

AUD-NZD Free Signal! Buy!
Hello,Traders!
AUD-NZD has been falling
Recently and the pair is locally
Oversold so after it hits the
Horizontal support level
Of 1.0956 a long trade
Can be entered with the
TP of 1.0990 and SL of 1.0937
Buy!
Comment and subscribe to help us grow!
Check out other forecasts below too!
Disclosure: I am part of Trade Nation's Influencer program and receive a monthly fee for using their TradingView charts in my analysis.

AUDNZD Technical Analysis! SELL!
My dear followers,
I analysed this chart on AUDNZD and concluded the following:
The market is trading on 1.1089 pivot level.
Bias - Bearish
Technical Indicators: Both Super Trend & Pivot HL indicate a highly probable Bearish continuation.
Target - 1.1072
About Used Indicators:
A super-trend indicator is plotted on either above or below the closing price to signal a buy or sell. The indicator changes color, based on whether or not you should be buying. If the super-trend indicator moves below the closing price, the indicator turns green, and it signals an entry point or points to buy.
———————————
WISH YOU ALL LUCK

AUDNZD will soon finish bullish cycle and usher in a sell-off? AUDNZD has been on a 2-year rally for 2 years. However, it appears price is correcting the sell-off in the last quarter of 2022 before the eventual resurgence.
Structurally, a zigzag structure is emerging with (A) and (B) finished as impulse and double zigzag structures respectively. Meanwhile, wave (C) is on the verge of completing an ending diagonal structure. Price is currently in the 5th leg of wave (C) and may continue to 1.12 which is roughly 100% of (A) from (B). So I believe, the sellers may have a chance between 1.12-1.135 in 2025.
Caveats
1. The 4th wave of the proposed ending diagonal could extend lower but should finish above 1.081 to keep the diagonal valid. Thus, buyers can buy lower again toward the zone mentioned above.
2. The (A)-(B)-(C) of ((B)) doesn't correspond in time magnitude with the sharp wave ((A)) impulse decline. Thus, the current rally alternatively could be a leading diagonal. If so, a pullback should happen as expected but shallower (should end above ((A)). Similar path but different counts.

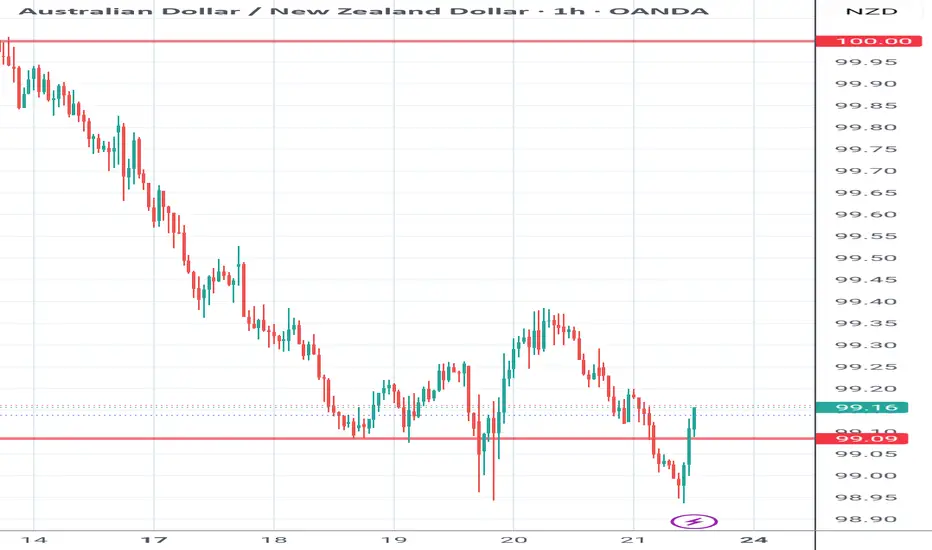
AUDNZD at Key Support Level - Rebound Towards 1.10100?OANDA:AUDNZD has reached a significant support zone, highlighted by previous price reactions and strong buying interest. This area has previously acted as a key demand zone, increasing the likelihood of a bounce if buyers step in.
The current market structure suggests that if the price confirms support within this zone, we could see a bullish reversal. A successful rebound could push the pair toward the 1.10100 level, a logical target based on previous price behavior and current market dynamics. Monitoring candlestick patterns and volume at this critical zone is essential for identifying buying opportunities.
Just my take on support and resistance zones, not financial advice. Always confirm your setups and trade with solid risk management.
Best of luck!

AUD/NZD BULLS ARE STRONG HERE|LONG
Hello, Friends!
AUD/NZD pair is trading in a local downtrend which we know by looking at the previous 1W candle which is red. On the 3H timeframe the pair is going down too. The pair is oversold because the price is close to the lower band of the BB indicator. So we are looking to buy the pair with the lower BB line acting as support. The next target is 1.100 area.
Disclosure: I am part of Trade Nation's Influencer program and receive a monthly fee for using their TradingView charts in my analysis.
✅LIKE AND COMMENT MY IDEAS✅

audnzd sell daily time framelooking for sell audnzd daily time frame beautyfull breash trend im wating for close dailly time canddle under the support and then reset the support lavel only then sell

BUYGod First
Minimum Risk Maximum Reward
Action Backed Believe
# faith, strategy, and execution all in one #
