AUDNZD in possible bullish reversalAUDNZD could be in a bullish reversal pattern on 1 Hr timeframe. A bullish divergence has already been formed and the pair is a bit sideways for the time being.
Tomorrow on 26th Feb 2025, AUD CPI Y/Y new is coming which is expected to be better than previous results, which could strengthen AUD as compared to NZD and reverse the trend.
With a bit hawkish stance of Australian CB resulting in a recent lowering of cash rate to 4.1%, and net positions improving in COT data for last two weeks I am expecting for a trend reversal but will wait for a positive news on CPI data.
Buy stop orders to be placed above 1.10859 with stop loss to be placed around 1.10503.
AUDNZD trade ideas

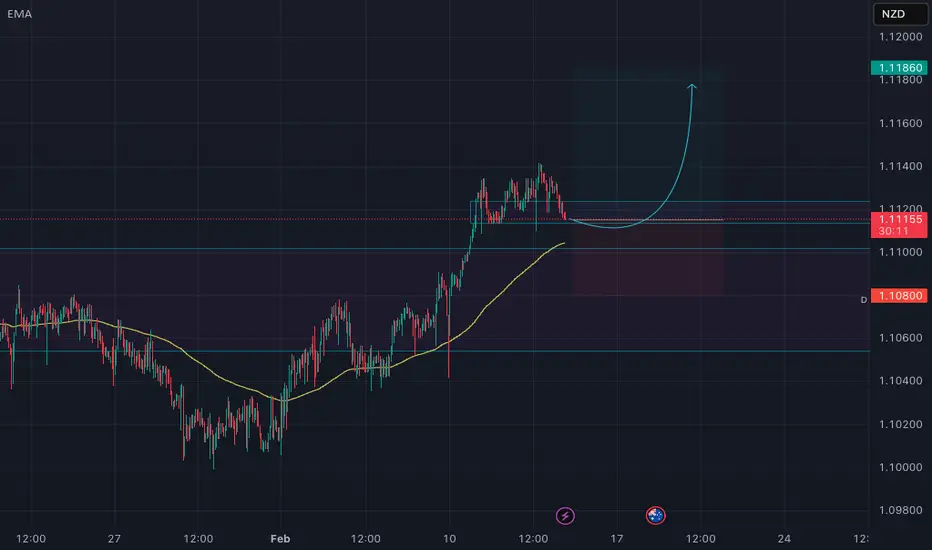
AUDNZD: Potential Buy Opportunity at Key Support LevelOANDA:AUDNZD is approaching a significant support zone. This zone has consistently acted as a key area of interest where buyers regained control, leading to notable reversals in the past. The current moves suggests the potential for a bullish reaction if price action confirms rejection through signals such as bullish engulfing candles, long lower wicks, or increased buying volume.
If the support holds, I anticipate a move upward toward the 1.10860 level, aligning with the expectation of a short-term reversal. However, if the price breaches this zone and sustains below it, the bullish outlook may be invalidated and we could potentially see a bigger downside.
Monitoring candlestick patterns and volume at this critical zone is essential for identifying buying opportunities. Proper risk management is advised to navigate potential volatility. If you have any thoughts on this setup or additional insights, drop them in the comments!

AUDNZDWe can attempt to buy AUDNZD from specified level as it make HL , also 0.5 FIB level occur , also there is hidden bullish divergence occur indicate that it moves upward.
SL , TP mention in chart.

AUDNZD AnalaysisAUDNZD Analaysis
The AUDNZD pair is currently demonstrating a bullish trend on the higher time frames, aligning favorably with our analysis. The price is now approaching a significant support level, which requires a retest for confirmation. This presents a critical juncture, and it is advisable to adopt a cautious, wait-and-see approach to assess how the market responds to this level. A decisive break below the support could invalidate our bullish outlook, while a successful retest and consolidation above this level would strengthen the case for the continuation of the upward trend.
We will continue to monitor the market's behavior closely. I hope you all had a successful and profitable trading week, and I wish you a relaxing and enjoyable weekend ahead.

AUD_NZD RISKY LONG|
✅AUD_NZD fell again to retest the support of 1.1075
But it is a strong key level
So I think that there is a high chance
We will see a bullish rebound and a move up
LONG🚀
✅Like and subscribe to never miss a new idea!✅

AUDNZD FORECASTIt is looking good guys! However the notice that I want you to take from this trade is, On the steep correction. When it comes to steep corrections like what we have in this pair we need look it with a different approach. And In this video I just covered the best way to look on it! Watch it to the end to get the most of it!

AUDNZD Wave Analysis – 19 February 2025
- AUDNZD reversed from the resistance zone
- Likely to fall to support level 1.1100
AUDNZD currency pair recently reversed from the resistance zone between the key resistance level 1.1165 (former monthly high from last November) and the resistance trendline of the wide weekly up channel from 2022.
This resistance zone was further strengthened by the upper daily and weekly Bollinger Bands.
Given the strength of the resistance level 1.1165, AUDNZD can be expected to fall to the next support level 1.1100.

AUDNZD The Target Is UP! BUY!
My dear friends,
Please, find my technical outlook for AUDNZD below:
The instrument tests an important psychological level 1.1075
Bias - Bullish
Technical Indicators: Supper Trend gives a precise Bullish signal, while Pivot Point HL predicts price changes and potential reversals in the market.
Target - 1.1114
About Used Indicators:
Super-trend indicator is more useful in trending markets where there are clear uptrends and downtrends in price.
———————————
WISH YOU ALL LUCK


AUD/NZD could be veering towards a breakoutThe RBNZ just delivered their third 50bp cut in a row, and they have left the door open for further easing this year. And given I expect the RBNZ's cash rate to remain beneath the RBA's for the remainder of the year, it could pave the way for a bullish breakout on AUD/NZD.
Matt Simpson, Market Analyst at City Index and Forex.com

AUDNZD is ready to go downThank you for your support and DMs. This is another good oportunity in forex. Please trade wisely and according to your account balance.
Thank you and have a good trading ahead

Long trade
Pair: AUDNZD
Date: Tuesday, 18th February 2025
Time: 6:45 PM (NY Time)
Session: London to NY Session PM
Trade Details:
Entry: 1.10996
Profit Level: 1.11679 (+0.62%)
Stop Level: 1.10895 (-0.09%)
Risk-Reward Ratio (RR): 6.76
Reason: Buyside trade is based on a bullish market structure, liquidity grabs, and demand zone validation.

AUDNZDWe detect a strong demand zone now if the price come back and show as confirmation we take it long to the next supply zone
LR

AUDNZD BUY & SELL Institutional Entry Setups🛠 Trade Plan #1: Buy from Discount Zone
🟢 Type: Intraday Trend Continuation Buy
✅ Entry Zone: 1.1090-1.1060 (Bullish OB + FVG).
✅ Stop Loss: 1.1045 (Below Institutional Order Block).
✅ Take Profits:
🎯 TP1: 1.1120 (First rejection point).
🎯 TP2: 1.1150 (Next liquidity zone).
🎯 TP3: 1.1180 (Potential exhaustion point).
✅ Confidence Level: HIGH (Multiple Smart Money Confluences).
📌 Execution Strategy:
✔ Wait for price to retrace into 1.1090-1.1060 zone.
✔ Look for rejection (bullish engulfing / wick rejections).
✔ Enter aggressively OR use a pending limit order.
🛠 Trade Plan #2: Aggressive Short from Premium Zone
🔴 Type: Short-Term Liquidity Grab Sell
✅ Entry Zone: 1.1150-1.1180 (Bearish OB).
✅ Stop Loss: 1.1205 (Above recent liquidity grab).
✅ Take Profits:
🎯 TP1: 1.1120 (Quick Rejection).
🎯 TP2: 1.1090 (Liquidity Below).
✅ Confidence Level: MEDIUM (Counter-Trend, Needs Confirmation).
📌 Execution Strategy:
✔ Enter ONLY IF bearish rejection occurs at 1.1150.
✔ Monitor LTF bearish signs (Break of Structure & wick rejection).
🔥 Final Institutional Decision:
📌 Execute the Buy from 1.1090-1.1060 if:
✔ Price retraces to discount zone.
✔ Liquidity grab happens.
✔ Bullish rejection confirms institutional buying.
📌 Consider the Short from 1.1150-1.1180 only if:
✔ Bearish rejection at OB.
✔ Break of structure to confirm Smart Money reversal.
🚀 Final Bias: Short-term retracement → Then bullish continuation.
✅ Primary Trade: Buy from 1.1090-1.1060 (Smart Money Accumulation).
✅ Secondary Trade (Speculative): Short from 1.1150 with caution.

AUDNZD: Short Signal with Entry/SL/TP
AUDNZD
- Classic bearish formation
- Our team expects pullback
SUGGESTED TRADE:
Swing Trade
Short AUDNZD
Entry - 1.1136
Sl - 1.1158
Tp - 1.1087
Our Risk - 1%
Start protection of your profits from lower levels
❤️ Please, support our work with like & comment! ❤️

AUDNZD Ascending Triangle Bullish Breakout Targeting 1.1340The AUDNZD currency pair is currently trading at 1.1140, with a target price of 1.1340, suggesting a potential upward move of 100+ pips. The pair is forming an ascending triangle pattern, a classic bullish continuation pattern. This pattern typically forms when the price consistently makes higher lows while encountering a horizontal resistance level, signaling a potential breakout above the resistance. Traders are looking for a confirmation of the breakout above the resistance level to target 1.1340.
From a technical perspective, the ascending triangle is often a sign of market indecision, but it’s typically followed by a breakout to the upside when the price pushes through the resistance at the top of the triangle. In this case, the breakout would likely target the 1.1340 level, where the next significant resistance could come into play.
On the fundamental side, the Australian dollar has been relatively stronger recently due to robust commodity exports, particularly iron ore and coal. In contrast, the New Zealand dollar faces pressure from a more dovish outlook from the Reserve Bank of New Zealand, which has recently taken a cautious approach to monetary policy. These economic dynamics could support the bullish case for AUDNZD, especially if the breakout occurs in favor of the Aussie dollar.
In summary, the ascending triangle pattern on AUDNZD points toward a bullish breakout above the 1.1160 resistance. If confirmed, the pair could target the 1.1340 level. Keep an eye on any upcoming economic data from both Australia and New Zealand, as these could provide further confirmation or invalidate the breakout.

AUDNZD is ready to push againNo comment needed. All information is in the chart analysis.
Steps to follow:
Analyze yourself.
Take the position with SL and Take Profits.
Wait, it may take a couple of days, so take a break and step away from the screen from time to time, just like I do :)
Get the result.
I will update the trade every day.
Like, comment with your good mood or viewpoint, share with your circle. It’s together that we get stronger!
Good trades, Traders!
The golden bear

RBA dovish pricing should comes inalready in hedging zone
RBA was slightly dovish
Check out our socials for some nice insights.
Let us know if there're any pair you like to see or if this is something you like.
Do ask if you have any question
Not as refined as our direct trade setups. More for advanced active traders.
information created and published doesn't constitute investment advice!
NOT financial advice

bullish ideaPrice is in bullish trend as per 4H, entry can be taken at fib level 0.5%, sl last higher low and tp is last higher high as mentioned in the chart.


AUDNZD is BullishPrice is in an uptrend, consistently printing higher highs and higher lows, currently it has retraced to around 0.45, and also has a trendline support. If the bulls manage to assume control of the price action, then we can expect another lag up from here as per Dow theory. Targets are mentioned on the chart.

Short trade
4Hr TF overview
Sellside trade
Pair AUDNZD
Entry 5min TF
Structure Day
Entry 4Hr
Thu 13th Feb 25
5.00 pm (NY Time)
LND to NY Session PM
Entry 1.11112
Profit level 1.10544 (0.51%)
Stop level 1.11346 (0.21%)
RR 2.43
Reason: Observing price reactions at a pivotal supply level (1.11112) indicated a retracement was likely to balance price through sellside delivery. This confirmed the short setup, aligning with the expected market structure shift.
