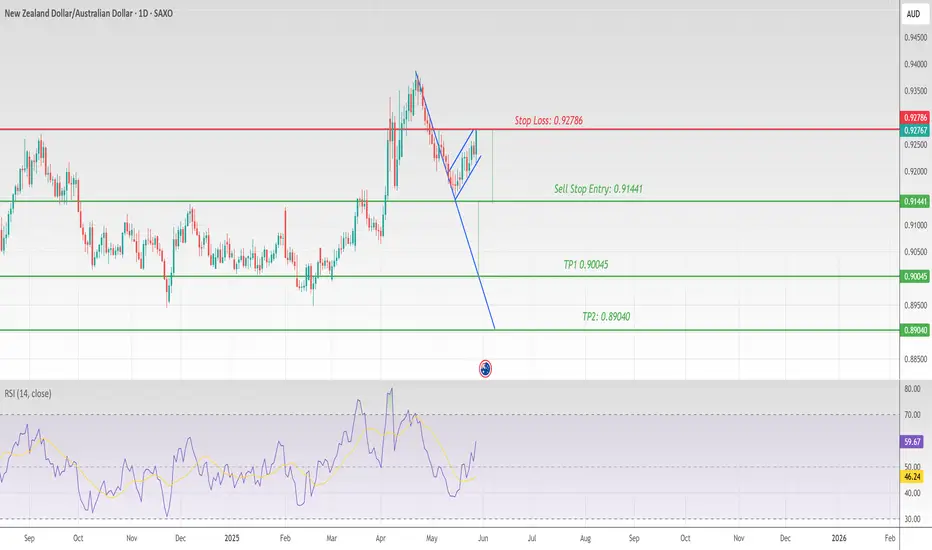
NZDAUD 1 Daily Chart Bearish Flag Continuation PatternNZDAUD 1 Daily Chart Bearish Flag Continuation Pattern
Stop Loss: 0.92786
Sell Stop Entry: 0.91441
TP1 0.90045
TP2: 0.89040
No Divergence
AUDNZD trade ideas
AUD/NZD For Bearishwait for pull-back near by entry point and then go short
general trend is down trend
have fun :)
AUD/NZD - Strong Bullish Trade Setup🔥 AUD/NZD 8H Bullish Setup – Demand Zone + Liquidity Grab
📍 Current Structure:
Price is pulling back into a refined demand zone, perfectly aligned with the 71% Fibonacci retracement.
This zone also holds trendline support from the higher timeframe — strong structural confluence.
Price is forming a corrective wave, likely completing a classic ABC pattern down into demand.
📊 Volume Insight:
A volume spike at the lows hints at aggressive buying — likely institutional.
Smart money may be accumulating just before a bullish push.
📈 Play Idea:
Looking for price to react inside the 71% zone, potentially forming a bullish engulfing or BOS (break of structure).
Clear target is Buy Side Liquidity (BSL) above recent highs — that's where stops are clustered.
🧠 Confluences:
Demand Zone ✅
71% Fib Level ✅
Trendline Support ✅
Volume Spike ✅
Buy Side Liquidity Target ✅
🎯 Bias: Strongly Bullish
Waiting for a clean trigger — bullish candle confirmation or BOS.
This setup screams smart money accumulation.

AUDNZD-H1-SHORTThe price, previously supported by ascending trendlines, has recently broken below these lines, signaling a potential reversal in momentum. The Ichimoku cloud (Kumo) highlights critical support and resistance zones, with the price moving outside the cloud, reinforcing the breakdown of the prior uptrend. The Tenkan-sen and Kijun-sen lines confirm this shift through their crossover, aligning with the wave structure and indicating a bearish turn. This setup suggests an opportunity for a short position, as the market may be entering a consolidation or downtrend phase.
If you liked this analysis, hit the BOOST !


So Gold Dropped, Anyone caught this So gold fell to low key point.
From the fundamental perspectives, anything strengthening the dollar?
Share information

AUDNZD: Long Trading Opportunity
AUDNZD
- Classic bullish setup
- Our team expects bullish continuation
SUGGESTED TRADE:
Swing Trade
Long AUDNZD
Entry Point - 1.0821
Stop Loss - 1.0797
Take Profit - 1.0866
Our Risk - 1%
Start protection of your profits from lower levels
Disclosure: I am part of Trade Nation's Influencer program and receive a monthly fee for using their TradingView charts in my analysis.
❤️ Please, support our work with like & comment! ❤️

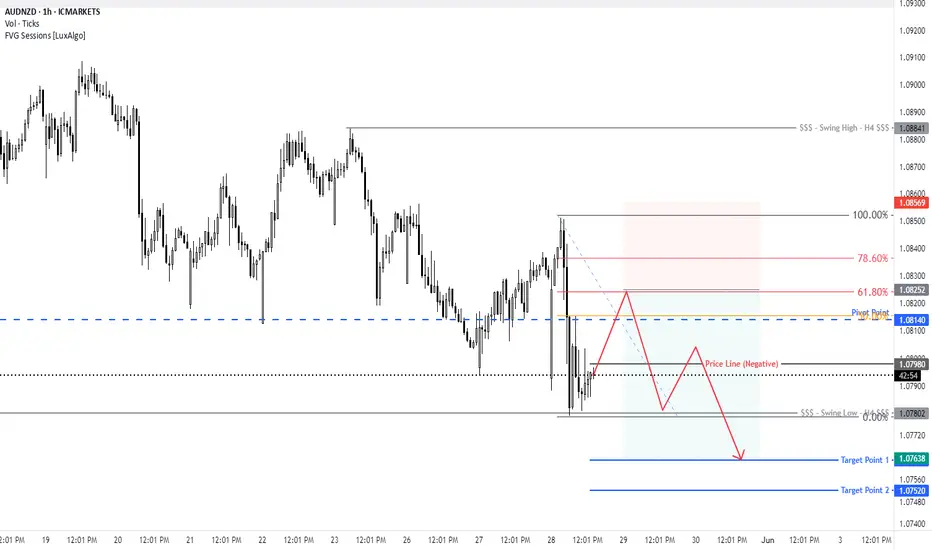
Falling towards 61.8% Fibonacci support?AUD/NZD is falling towards the pivot and could bounce to the 1st resistance.
Pivot: 1.0750
1st Support: 1.07095
1st Resistance: 1.08521
Risk Warning:
Trading Forex and CFDs carries a high level of risk to your capital and you should only trade with money you can afford to lose. Trading Forex and CFDs may not be suitable for all investors, so please ensure that you fully understand the risks involved and seek independent advice if necessary.
Disclaimer:
The above opinions given constitute general market commentary, and do not constitute the opinion or advice of IC Markets or any form of personal or investment advice.
Any opinions, news, research, analyses, prices, other information, or links to third-party sites contained on this website are provided on an "as-is" basis, are intended only to be informative, is not an advice nor a recommendation, nor research, or a record of our trading prices, or an offer of, or solicitation for a transaction in any financial instrument and thus should not be treated as such. The information provided does not involve any specific investment objectives, financial situation and needs of any specific person who may receive it. Please be aware, that past performance is not a reliable indicator of future performance and/or results. Past Performance or Forward-looking scenarios based upon the reasonable beliefs of the third-party provider are not a guarantee of future performance. Actual results may differ materially from those anticipated in forward-looking or past performance statements. IC Markets makes no representation or warranty and assumes no liability as to the accuracy or completeness of the information provided, nor any loss arising from any investment based on a recommendation, forecast or any information supplied by any third-party.

AUD_NZD SUPPORT AHEAD|LONG|
✅AUD_NZD is going down now
But a strong support level is ahead at 1.0780
Thus I am expecting a rebound
And a move up towards the target at 1.0827
LONG🚀
✅Like and subscribe to never miss a new idea!✅
Disclosure: I am part of Trade Nation's Influencer program and receive a monthly fee for using their TradingView charts in my analysis.

AUDNZD (SUPPLY+BOS+OTE)Hello traders!
We have supply + OTE.
Now we can expect reversal on LTF from 705 fib level + 0.5 Supply zone.
Have a profitable day and don't forget to subscribe for more updates!
If you like this idea drop a like, leave a comment.

AUDNZD both scenarios possibles
OANDA:AUDNZD first analysis till target (attached), here is update and new view on AUDNZD.
We having trend line which is breaked, we having and H&S on top of trend, which also is breaked, price is after make bearish push, but in last period is stop progressing, its make few bouncens on sup zone 1.08230.
In case we see strong bearish push - break of 1.08350 we will have high chance to see higher bearish trend, in case we having break of top sup zone 1.09100 (violet line) we will having bullish confirm.
Personal more bullish, but lets wait for confirms.
Targets:
BULL: 1.10200, 1.10500
BEAR: 1.07800, 1.07500


AUD/NZD "Aussie vs Kiwi" Forex Bank Heist Plan (Day/Swing Trade)🌟Hi! Hola! Ola! Bonjour! Hallo! Marhaba!🌟
Dear Money Makers & Robbers, 🤑 💰💸✈️
Based on 🔥Thief Trading style technical and fundamental analysis🔥, here is our master plan to heist the AUD/NZD "Aussie vs Kiwi" Forex Bank. Please adhere to the strategy I've outlined in the chart, which emphasizes long entry. Our aim is to escape near the high-risk Red Zone. Risky level, overbought market, consolidation, trend reversal, trap at the level where traders and bearish robbers are stronger. 🏆💸"Take profit and treat yourself, traders. You deserve it!💪🏆🎉
Entry 📈 : "The heist is on! Wait for the MA breakout (1.07300) then make your move - Bullish profits await!"
however I advise to Place Buy stop orders above the Moving average (or) Place buy limit orders within a 15 or 30 minute timeframe most recent or swing, low or high level for Pullback entries.
📌I strongly advise you to set an "alert (Alarm)" on your chart so you can see when the breakout entry occurs.
Stop Loss 🛑: "🔊 Yo, listen up! 🗣️ If you're lookin' to get in on a buy stop order, don't even think about settin' that stop loss till after the breakout 🚀. You feel me? Now, if you're smart, you'll place that stop loss where I told you to 📍, but if you're a rebel, you can put it wherever you like 🤪 - just don't say I didn't warn you ⚠️. You're playin' with fire 🔥, and it's your risk, not mine 👊."
📍 Thief SL placed at the nearest/swing low level Using the 1H timeframe (1.06700) Day / Swing trade basis.
📍 SL is based on your risk of the trade, lot size and how many multiple orders you have to take.
🏴☠️Target 🎯: 1.08600 (or) Escape Before the Target
🧲Scalpers, take note 👀 : only scalp on the Long side. If you have a lot of money, you can go straight away; if not, you can join swing traders and carry out the robbery plan. Use trailing SL to safeguard your money 💰.
💰💵💴💸AUD/NZD "Aussie vs Kiwi" Forex Bank Heist Plan (Day / Swing Trade) is currently experiencing a bullishness🐂.., driven by several key factors.☝☝☝
📰🗞️Get & Read the Fundamental, Macro Economics, COT Report, Quantitative Analysis, Sentimental Outlook, Intermarket Analysis, Future trend targets... go ahead to check 👉👉👉🔗🔗
⚠️Trading Alert : News Releases and Position Management 📰🗞️🚫🚏
As a reminder, news releases can have a significant impact on market prices and volatility. To minimize potential losses and protect your running positions,
we recommend the following:
Avoid taking new trades during news releases
Use trailing stop-loss orders to protect your running positions and lock in profits
💖Supporting our robbery plan 💥Hit the Boost Button💥 will enable us to effortlessly make and steal money 💰💵. Boost the strength of our robbery team. Every day in this market make money with ease by using the Thief Trading Style.🏆💪🤝❤️🎉🚀
I'll see you soon with another heist plan, so stay tuned 🤑🐱👤🤗🤩

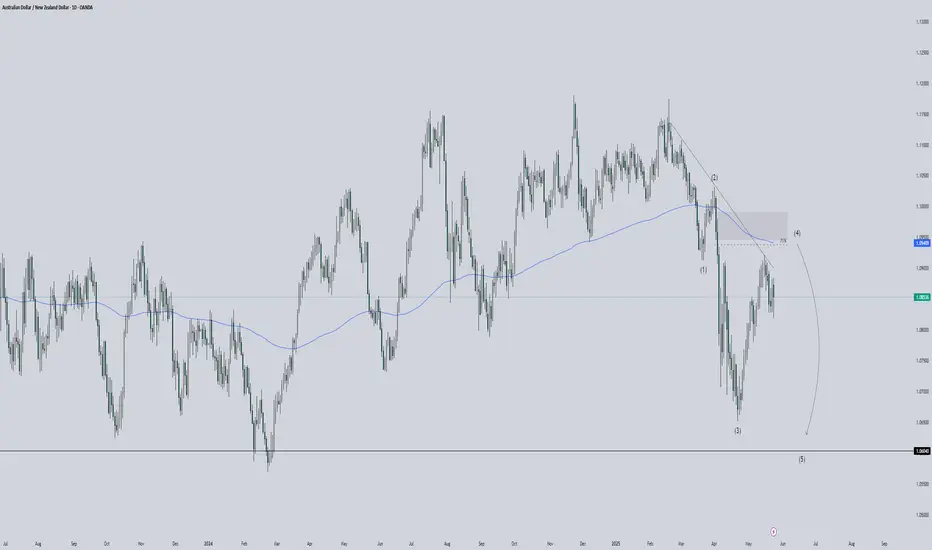
AUD/NZD - Elliots Wave for 5th leg!📉 AUD/NZD Daily Breakdown – Wave 5 Incoming?
We’ve got a textbook Elliott Wave setup unfolding:
Wave (1), (2), and (3) complete — with strong momentum confirming Wave (3).
Current price reacting from the 71% Fibonacci retracement, perfectly aligned with a supply zone and the 200 EMA.
Price rejection at this zone suggests Wave (4) may be complete.
🚨 Bearish confluence stacking:
Trendline resistance holds.
Price respecting the EMA as dynamic resistance.
Clear supply zone + fib rejection = high-probability short setup.
🎯 Wave (5) target: 1.06040
This could be the final leg down — traders, get your eyes on this!
AUDNZD SELL/SHORTBy utilizing levels, historical patterns, , we can formulate a hypothesis that the market might follow a similar trajectory if bearish sentiment prevails.

AUDNZD short movePrice have raised to the supply zone and any bullish reaction cloud leads price to decline.

BullishCurrently looking to buy AudNzd on a buy stop order
Targets
TP1 - 1.07304
TP2 - 1.08068
TP3 - 1.09214
SL - 1.06349

SHORT ON AUD/NZDAUD/NZD has a double top that formed after sweeping the Asian highs.
I will be selling this pair looking to make 50-80 pips.

AUDNZD 20.05.2025~+ RBA rhetoric (slightly dovish)
+ Seasonals
*approaching the mean of the regression trend

AUD/NZD For Bullishwait for pull-back near by entry point and then go long
general trend is up trend
NZD under pressure
have fun :)

AUDNZD - Potential SellHi Traders,
Here is my view on CMCMARKETS:AUDNZD
BIAS: SELL
Logical Analysis:
From 3rd Oct 2022 to 12th Dec 2022, the price has aggressively sold (from 1.14 level to 1.06). The belief is that the STORE that sell the pair has a lot of supply.
since the 1.06 level, buyers and sellers were in business and found agreement with the given price.
I am wondering if the STORE is happy (filled his order).
Technical Analysis: See Chart
Good Luck

AUDNZD SELL LIMIT 1,0848I am seeing a possible head and shoulders pattern to complete the prolonged bearish trend. After this week, I am expecting a rally on NZD pairs

Sell limit AUDNZDAnalysis still same for this pair we might get in early in the previous trade
all breaks above 1H TF recent high are fake break outs
we will try to sell the pair from the top point at 1.0910 with 20 pip stoploss
sell limit @ 1.0910
stoploss @ 1,0930
Target @ 1.0810
1 : 5 RR
